Feature #24998
closedmonitoring: Port and submit the ceph-metrics Grafana dashboards
Added by Lenz Grimmer almost 6 years ago. Updated about 3 years ago.
0%
Description
The Ceph Manager Dashboard intends to embed Grafana dashboards into various places of the UI. The ceph-metrics project already provides Grafana dashboards for all of these parts, so the intention is to convert these (e.g. remove the alert management and embedded navigation items) and submit them for inclusion in the Ceph git repo for consumption by the Manager Dashboard.
Files
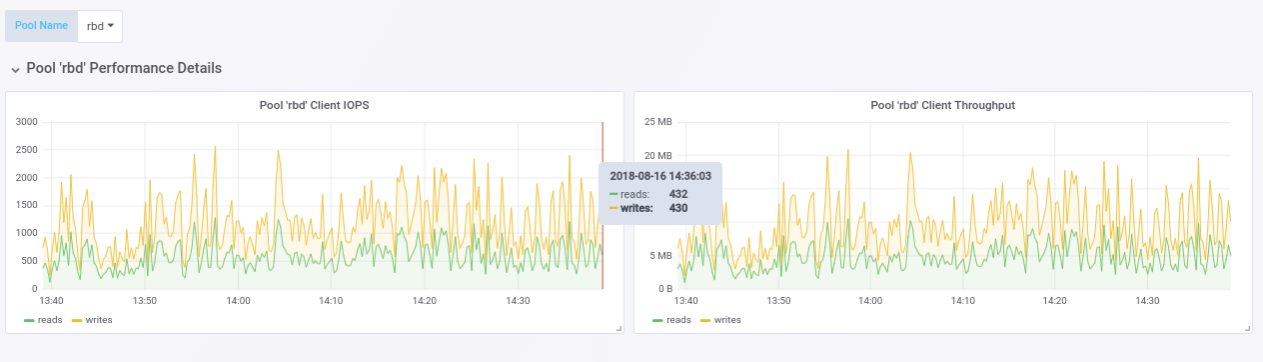
| pool-details.png (206 KB) pool-details.png | Paul Cuzner, 08/29/2018 12:31 AM | ||
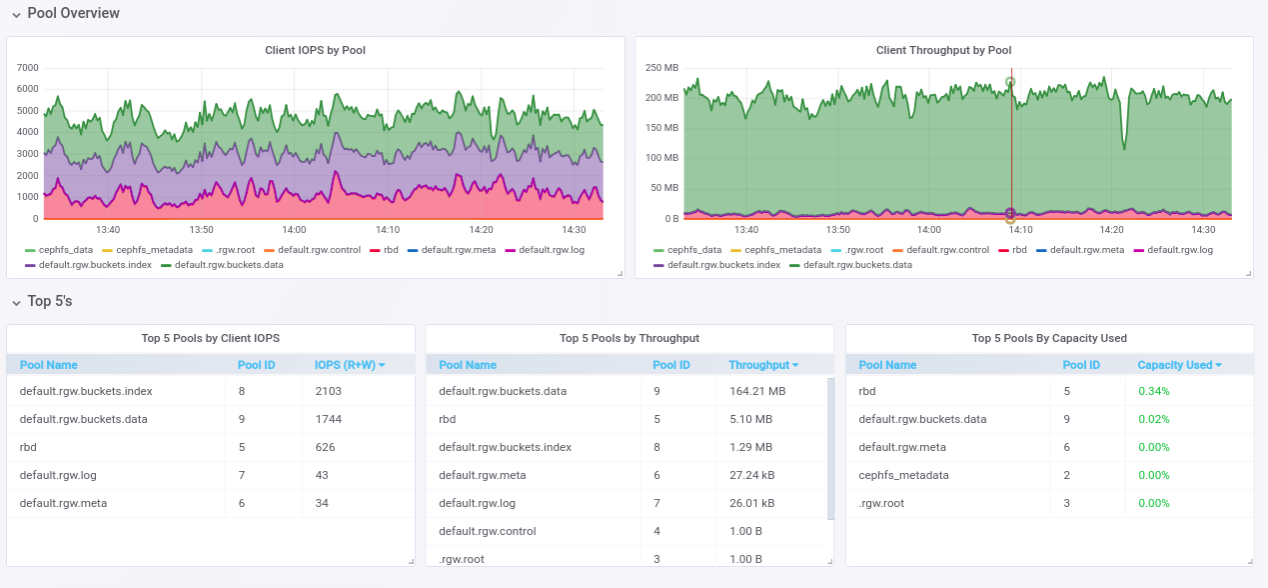
| pool-overview.png (214 KB) pool-overview.png | Paul Cuzner, 08/29/2018 12:31 AM | ||
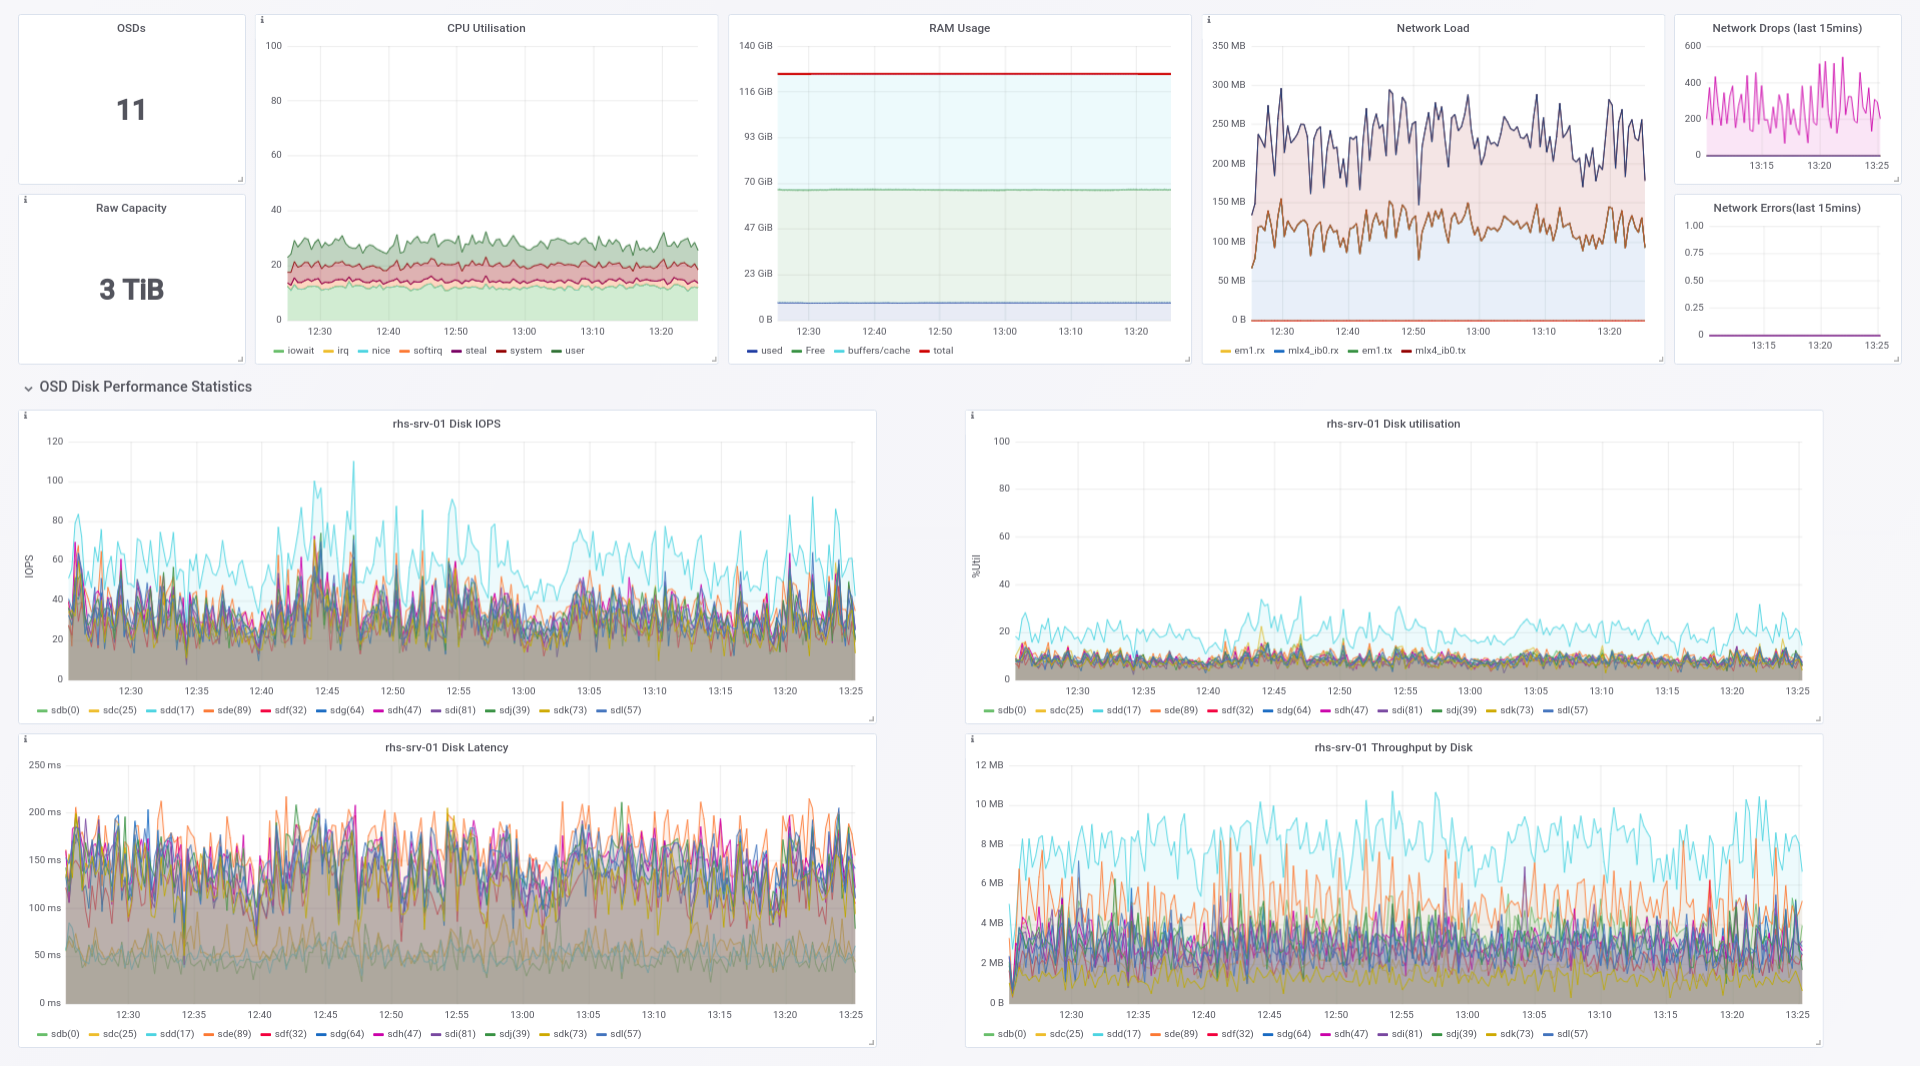
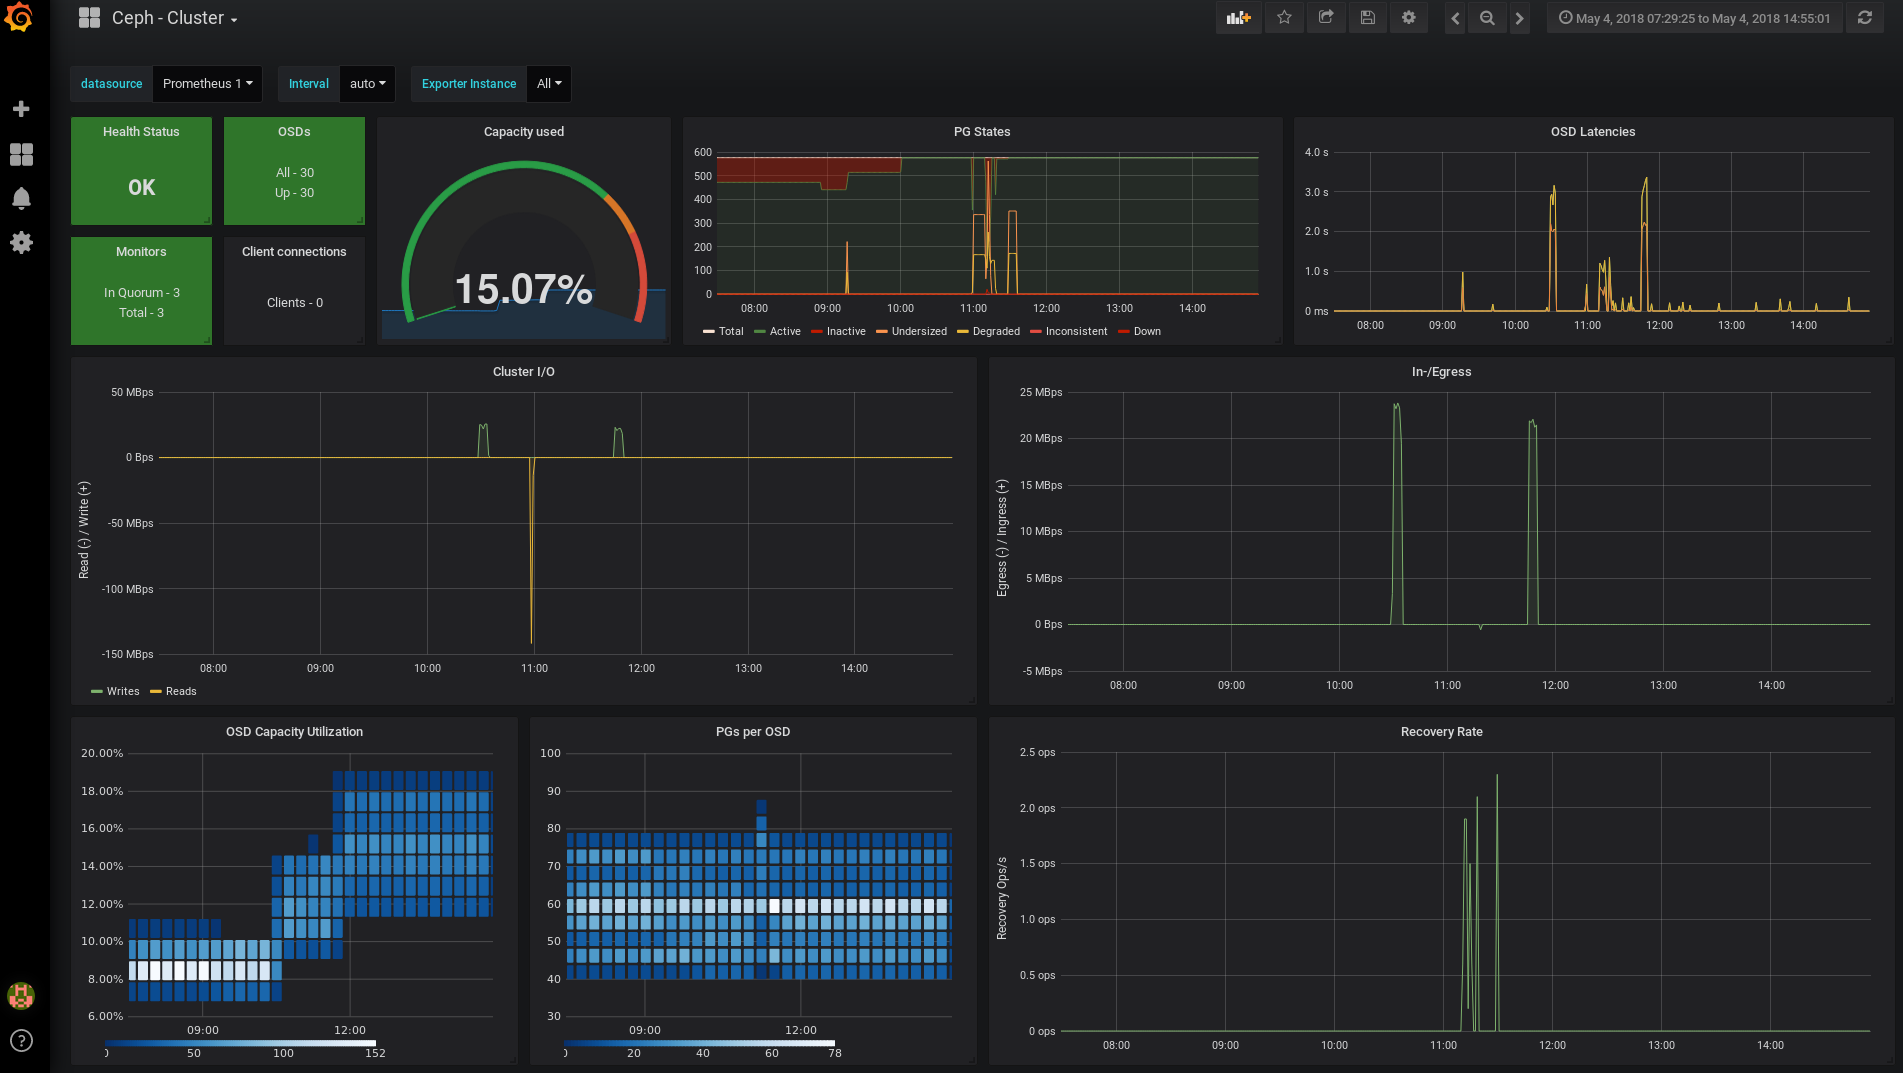
| host-details.resized.png (814 KB) host-details.resized.png | Paul Cuzner, 08/29/2018 12:31 AM | ||
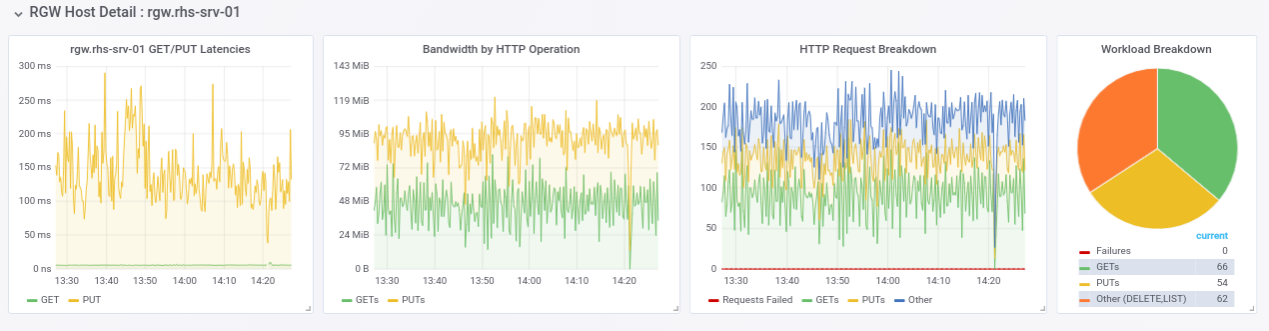
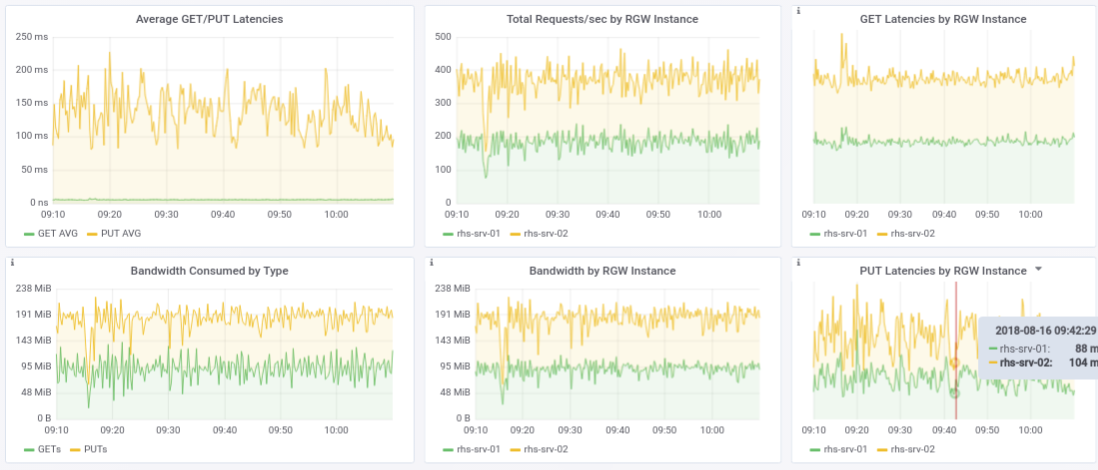
| rgw-detail.png (271 KB) rgw-detail.png | Paul Cuzner, 08/29/2018 12:31 AM | ||
| osd-performance.png (506 KB) osd-performance.png | Paul Cuzner, 08/29/2018 12:31 AM | ||
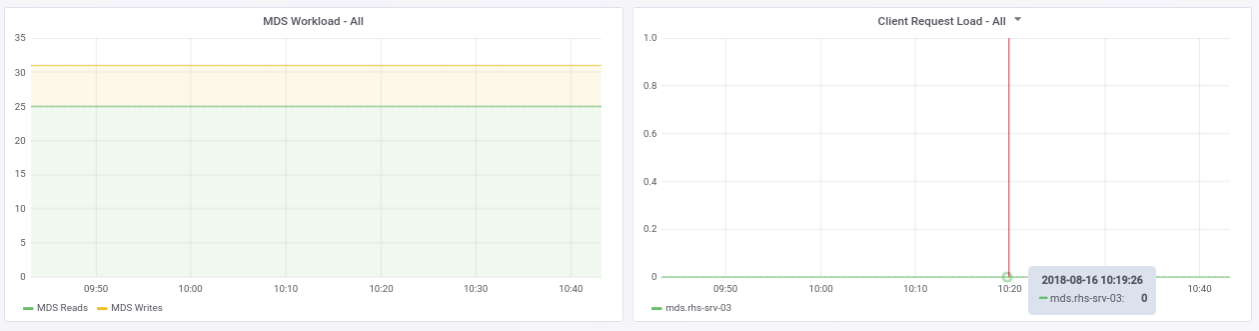
| mds-performance.png (51.4 KB) mds-performance.png | Paul Cuzner, 08/29/2018 12:31 AM | ||
| rgw-overview.png (289 KB) rgw-overview.png | Paul Cuzner, 08/29/2018 12:31 AM |
Updated by Lenz Grimmer almost 6 years ago
- Subject changed from monitoring: Port and submit the ceph-metrics Grafana dashboards for embedding into the Ceph to monitoring: Port and submit the ceph-metrics Grafana dashboards
Updated by Paul Cuzner over 5 years ago
- File host-details.resized.png host-details.resized.png added
- File pool-details.png pool-details.png added
- File pool-overview.png pool-overview.png added
- File rgw-detail.png rgw-detail.png added
- File osd-performance.png osd-performance.png added
- File mds-performance.png mds-performance.png added
- File rgw-overview.png rgw-overview.png added
I've attached screenshots of the current state of the dashboards that I've been working on to port from cephmetrics to the integrated grafana dashboard instance.
So far we have
host detail
pool overview
pool detail
rgw overview
rgw detail
mds performance (a little light this one currently)
osd performance (more work needed)
Comments/feedback encouraged!
Updated by Lenz Grimmer over 5 years ago
- Related to Feature #24999: mgr/dashboard: Embed Grafana Dashboards into the Mgr Dashboard UI added
Updated by Jan Fajerski over 5 years ago
Paul Cuzner wrote:
Comments/feedback encouraged!
Hi Paul,
Thx for the update and the screenshots. I'll list a few things that jumped at me while looking at the screenshots. Some will no doubt be a matter of taste, others might be me misinterpreting things. With a PR I could probably give more informed feedback. As an aside: are these dashboards meant to live in the ceph repo in the future?
- fill: I notice that most graphs have fill=1. My suggestion would be to reserve fill for stacked plots, whereas non-stacked should have fill=0. This just helps distinguishing which is which on sight.
- stacked vs not: Imho some graphs should not be stacked. E.g. RAM and CPU util make perfect sense to be stacked, network load maybe less so. For graphs with read/write or tx/rx "transform": "negative-Y" can be helpful (cp. Cluster io https://raw.githubusercontent.com/ceph/ceph/master/monitoring/grafana/screenshots/ceph-cluster1.png)
- Personally I prefer linewidth = 1 in all plots. Again a matter of taste, however I find it helps with clarity graphs with lots of line plots.
I think this is on a good way! I think pushing this to the ceph repo would greatly help discussion and the distillation of a "basic theme", i.e. a general preference in line width, fill settings and such.
Updated by Paul Cuzner over 5 years ago
PR raised - https://github.com/ceph/ceph/pull/24314
Apologies for the delay in getting these in
Updated by Paul Cuzner over 5 years ago
Thanks for the feedback.
Historically I've used fill=1 to make the graph stand out more against the light theme - especially with linewidth=1 and some of Grafana older palette choices!
For stacking, I can see where you're coming from. I tend to stack network throughput so at a glance you can see total load as opposed to adding two or more values in my head (I'm just lazy!). This approach also helps when you stack total load from all hosts so you can potentially see underused RGW's (i.e. load balancing issues).
I tend to use linewidth=2 for 'red line limits'. So in the case of RAM I show a red line which indicates available ram - the only other place it's used is pool-overview and that's not a red-line-limit, that's a bug..I'll fix that.
Updated by Paul Cuzner over 5 years ago
Jan - as far as the min version is concerned. IIRC, all the changes we needed to support prometheus with cephmetrics went into 12.2.5 - so the charts we have in this PR should be fine. Boris could confirm.
Updated by Ju Lim over 5 years ago
Jan Fajerski wrote:
Paul Cuzner wrote:
Comments/feedback encouraged!
Hi Paul,
Thx for the update and the screenshots. I'll list a few things that jumped at me while looking at the screenshots. Some will no doubt be a matter of taste, others might be me misinterpreting things. With a PR I could probably give more informed feedback. As an aside: are these dashboards meant to live in the ceph repo in the future?
- fill: I notice that most graphs have fill=1. My suggestion would be to reserve fill for stacked plots, whereas non-stacked should have fill=0. This just helps distinguishing which is which on sight.
- stacked vs not: Imho some graphs should not be stacked. E.g. RAM and CPU util make perfect sense to be stacked, network load maybe less so. For graphs with read/write or tx/rx "transform": "negative-Y" can be helpful (cp. Cluster io https://raw.githubusercontent.com/ceph/ceph/master/monitoring/grafana/screenshots/ceph-cluster1.png)
- Personally I prefer linewidth = 1 in all plots. Again a matter of taste, however I find it helps with clarity graphs with lots of line plots.
I think this is on a good way! I think pushing this to the ceph repo would greatly help discussion and the distillation of a "basic theme", i.e. a general preference in line width, fill settings and such.
Regarding "stacked vs not" and transforming rx/tx on a negative scale, it's an interesting idea but I have usability concerns about it since having them as rx/tx on opposite scale of the x-axis would make it difficult to do comparisons or even to look at it from a total (rx + tx) perspective.
Seems like the "linewidth = 1" references a bug at the time which I think Paul Cuzner has addressed.
As for fill=1 or 0, let's wait till we capture some user feedback as well as running Ceph Dashboard on some larger scale deployments to do some performance and scalability testing so we can see how Dashboard performs in different situations plus we can also see how we well the Grafana dashboards perform and make adjustments if needed. We'd be happy to go through this with you and the Ceph Dashboard community once we get some of this testing underway.
Updated by Lenz Grimmer over 5 years ago
- Status changed from New to Resolved
Updated by Ernesto Puerta about 3 years ago
- Project changed from mgr to Dashboard
- Category changed from 132 to General