Feature #24999
closedmgr/dashboard: Embed Grafana Dashboards into the Mgr Dashboard UI
0%
Files
Updated by Kanika Murarka over 5 years ago
- Related to Feature #25230: mgr/dashboard: Provide a full screen view for embedded grafana dashboard added
Updated by Kanika Murarka over 5 years ago
Please suggest tabs names for various views if not "Performance".
Updated by Ernesto Puerta over 5 years ago
What about "Graphs", "Stats", "Time-series", "Metrics", "Charts"?
Updated by Ju Lim over 5 years ago
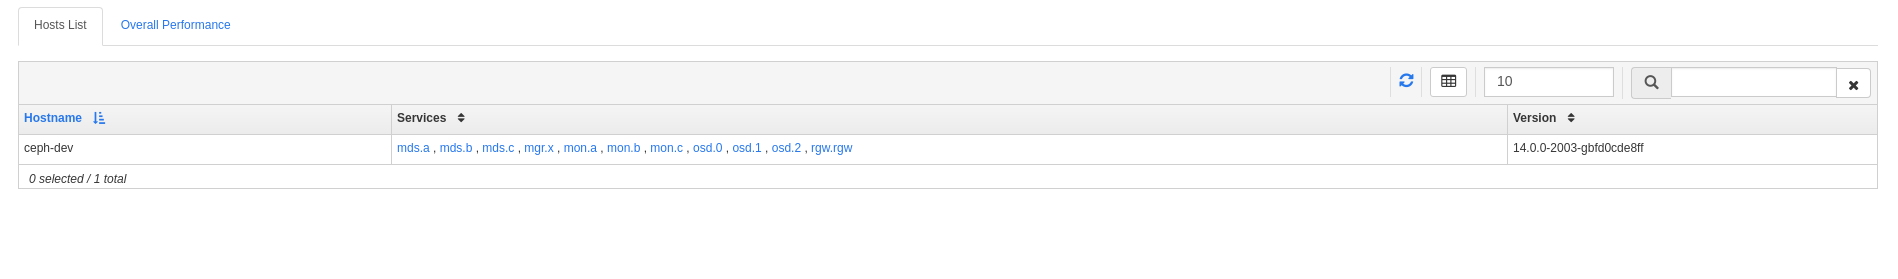
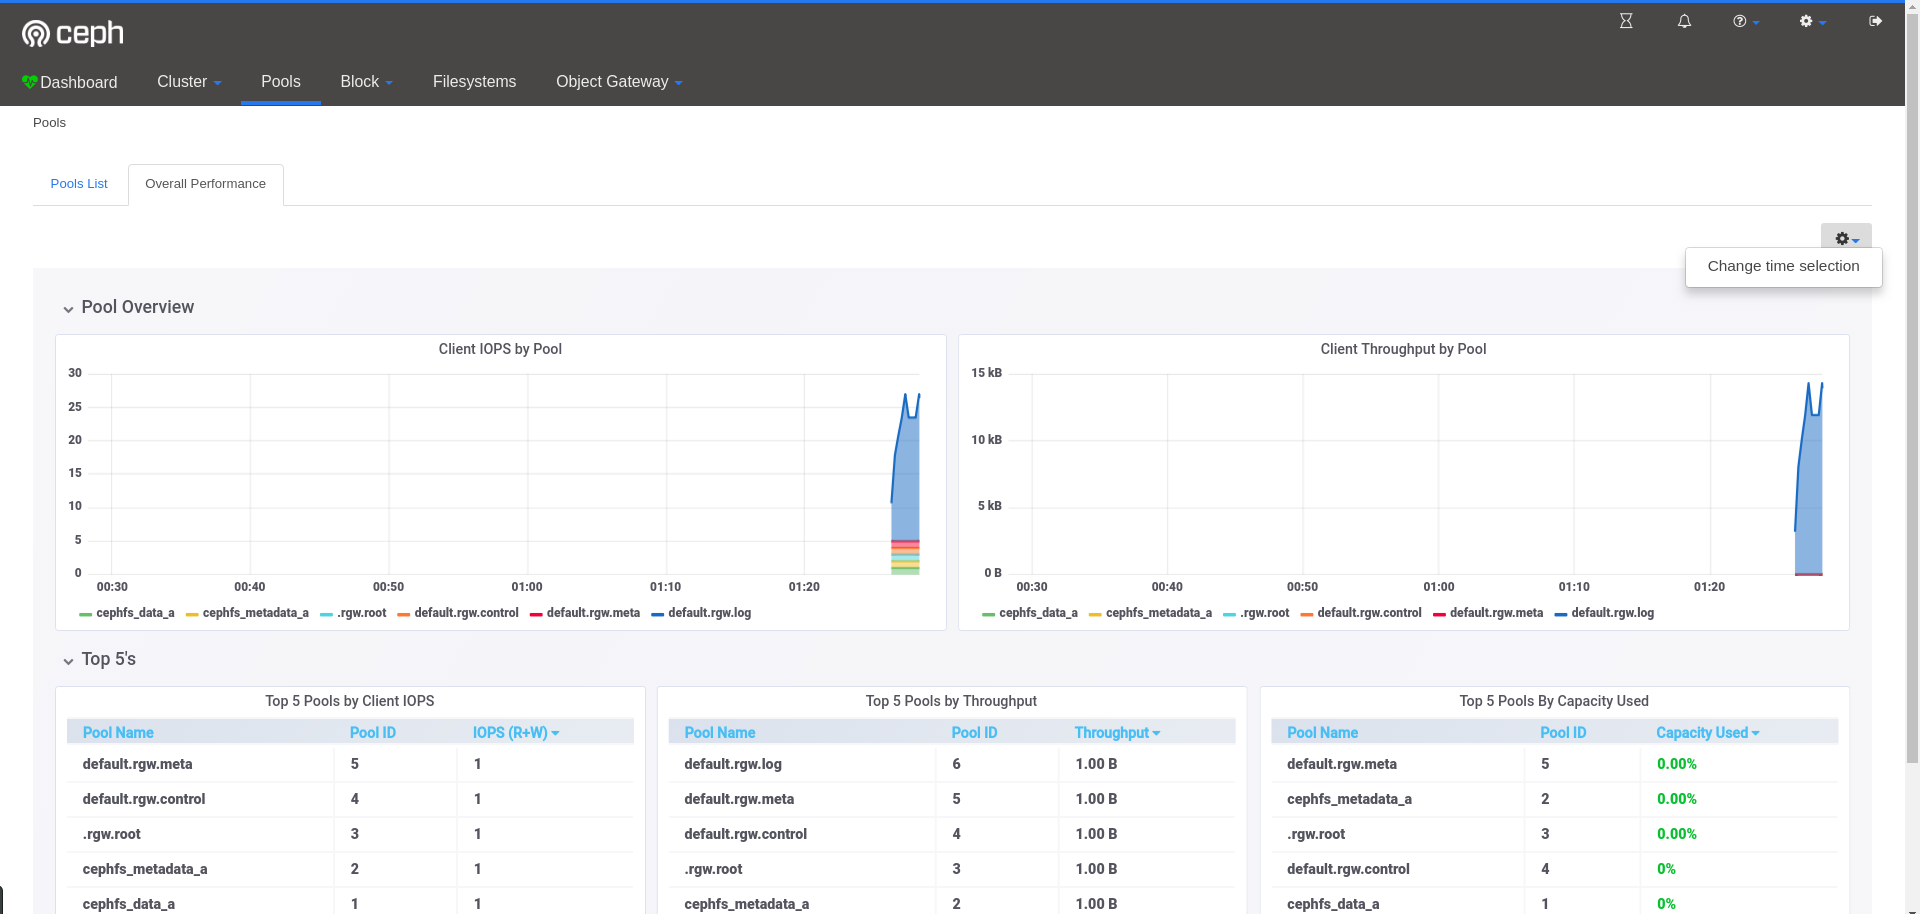
For the summary level performance tab (at the top), either "Overall Performance" or "Performance Summary" would work.
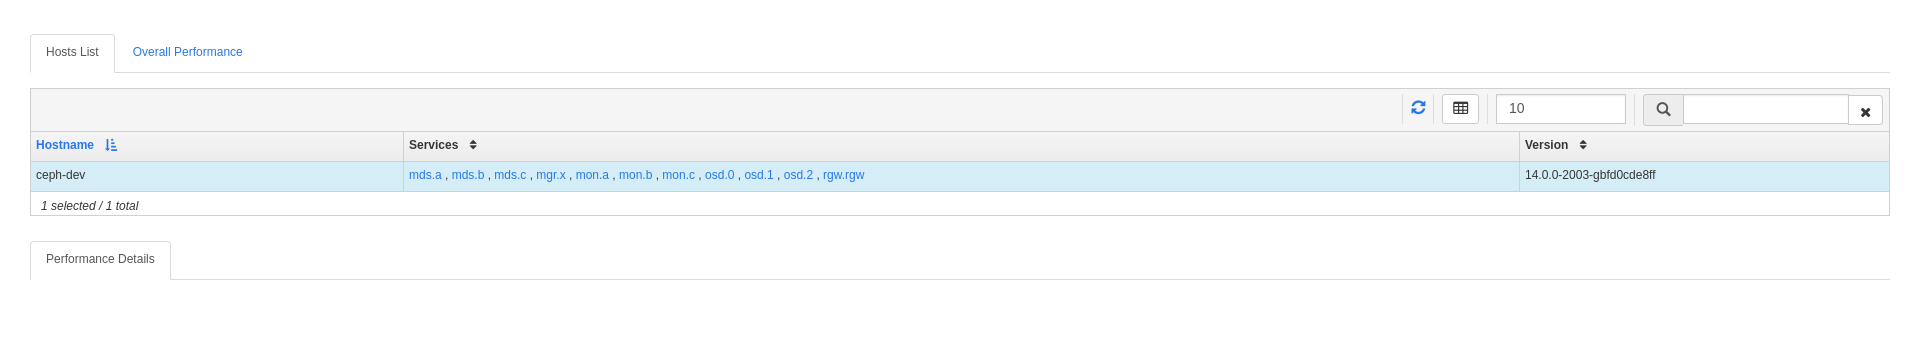
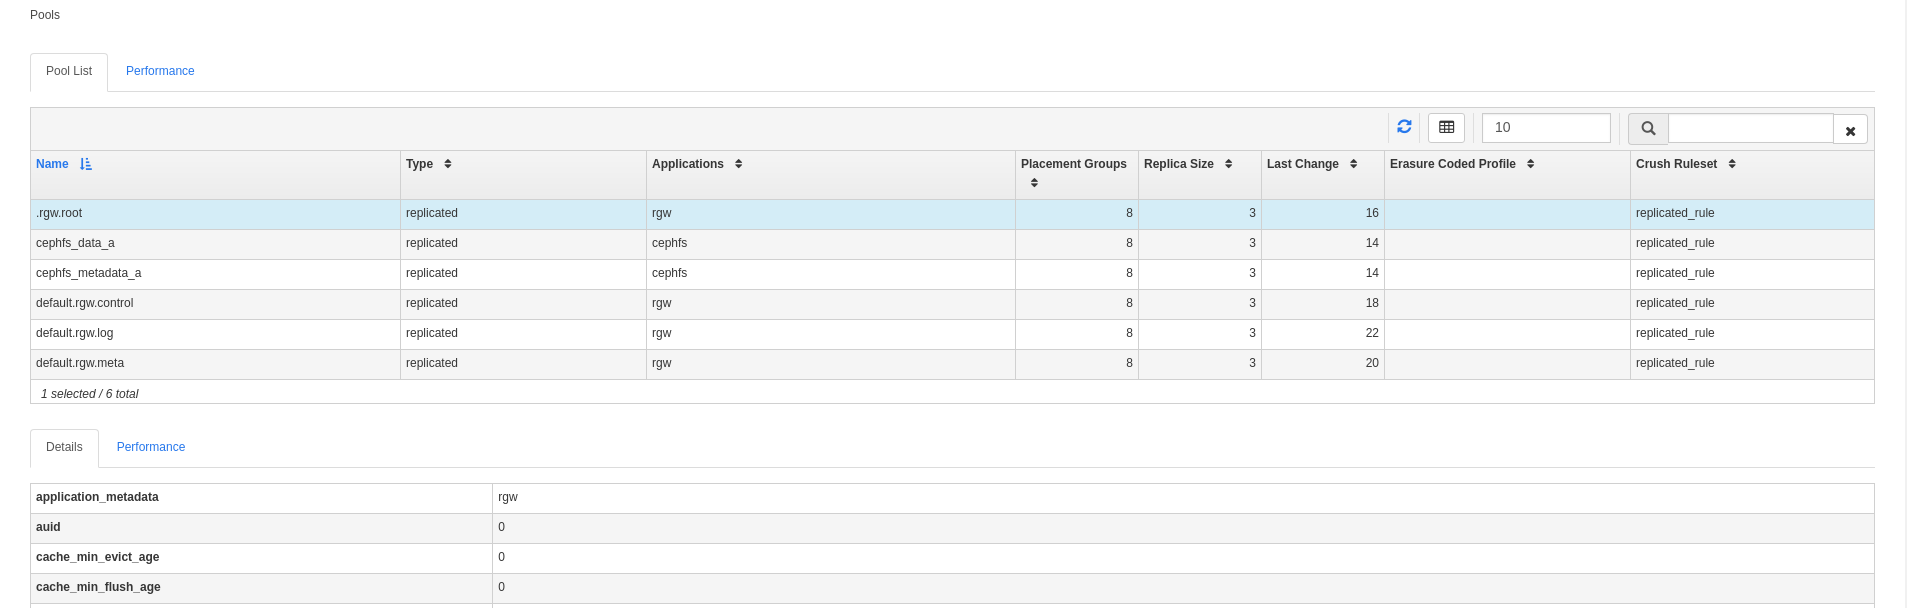
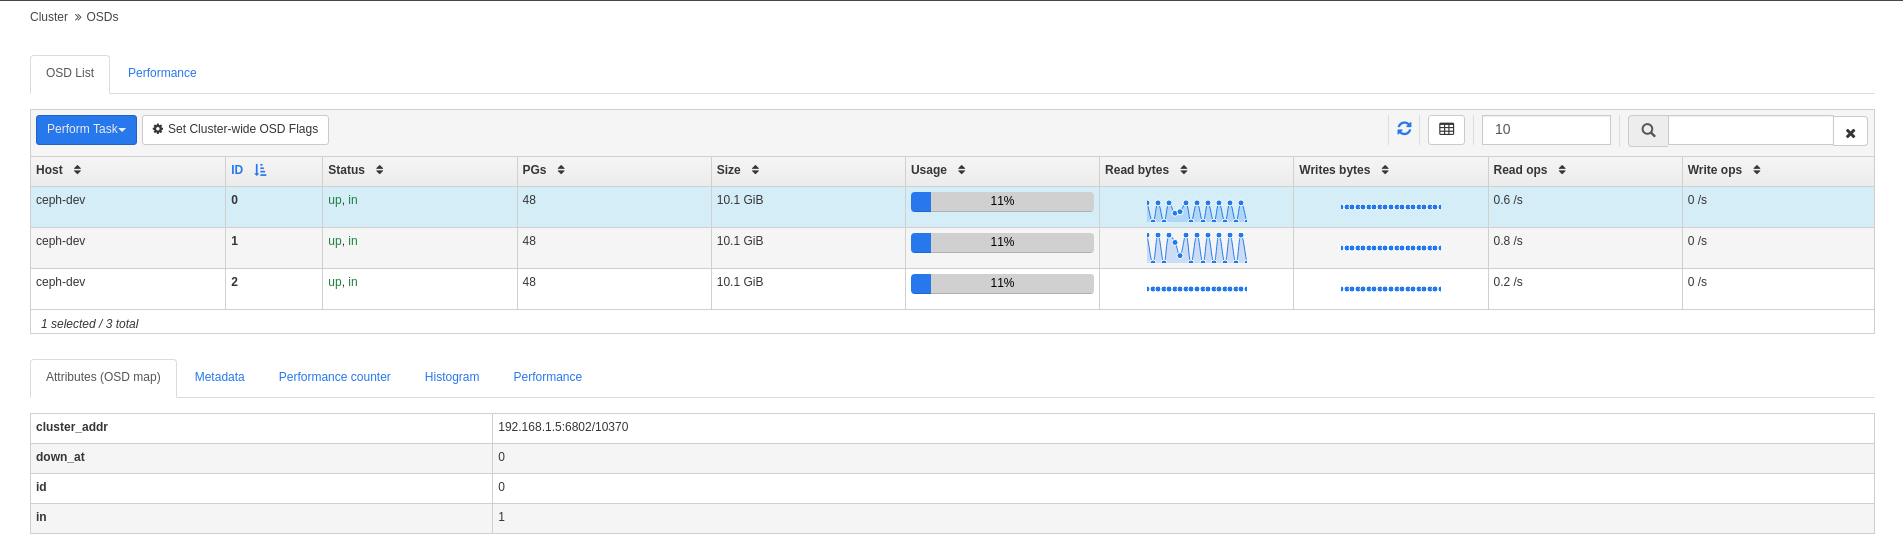
For the object-specific performance tab (at the bottom), either "<object> Performance" (e.g. OSD Performance) or "Performance Details" would work.
I'd avoid "Graphs", "Stats", "Time-series", "Metrics", "Charts" as those are overloaded and generic terms that could apply to non-performance data. Moreover, it will also be confusing with the existing "Performance Counter" and "Histogram" that exists in the OSD page.
Thoughts?
Updated by Kanika Murarka over 5 years ago
- File Screenshot from 2018-08-23 14-07-09.png Screenshot from 2018-08-23 14-07-09.png added
- File Screenshot from 2018-08-23 14-06-49.png Screenshot from 2018-08-23 14-06-49.png added
Ju Lim wrote:
For the summary level performance tab (at the top), either "Overall Performance" or "Performance Summary" would work.
For the object-specific performance tab (at the bottom), either "<object> Performance" (e.g. OSD Performance) or "Performance Details" would work.
I'd avoid "Graphs", "Stats", "Time-series", "Metrics", "Charts" as those are overloaded and generic terms that could apply to non-performance data. Moreover, it will also be confusing with the existing "Performance Counter" and "Histogram" that exists in the OSD page.
Thoughts?
Thanks Ju, I have updated high level tabs as "Overall Performance" and for specific performance "Performance Details".
Updated by Lenz Grimmer over 5 years ago
- Related to Feature #24998: monitoring: Port and submit the ceph-metrics Grafana dashboards added
Updated by Lenz Grimmer over 5 years ago
Pull request: https://github.com/ceph/ceph/pull/23666
Updated by Kanika Murarka over 5 years ago
- File screenshot-localhost-4200-2018.08.27-15-00-51.png screenshot-localhost-4200-2018.08.27-15-00-51.png added
- File screenshot-localhost-4200-2018.08.27-14-58-09.png screenshot-localhost-4200-2018.08.27-14-58-09.png added
As per discussion, Grafana will be embedded using dashboard embedding. The following elements will be hidden to avoid any user interventions:

Updated by Kanika Murarka over 5 years ago
- Related to Feature #35809: mgr/dashboard: Configure Grafana settings through UI added
Updated by Kanika Murarka over 5 years ago
- File Screenshot from 2018-09-25 22-42-34.png Screenshot from 2018-09-25 22-42-34.png added
- File Screenshot from 2018-09-25 22-42-39.png added
- File Screenshot from 2018-09-25 22-51-21.png Screenshot from 2018-09-25 22-51-21.png added
Updated by Kanika Murarka over 5 years ago
- File deleted (
Screenshot from 2018-09-25 22-42-39.png)
Updated by Kanika Murarka over 5 years ago
- File Screenshot from 2018-09-26 01-20-54.png added
Updated by Kanika Murarka over 5 years ago
- File deleted (
Screenshot from 2018-09-26 01-20-54.png)
Updated by Kanika Murarka over 5 years ago
Updated by Kanika Murarka over 5 years ago
Updated by Kanika Murarka over 5 years ago
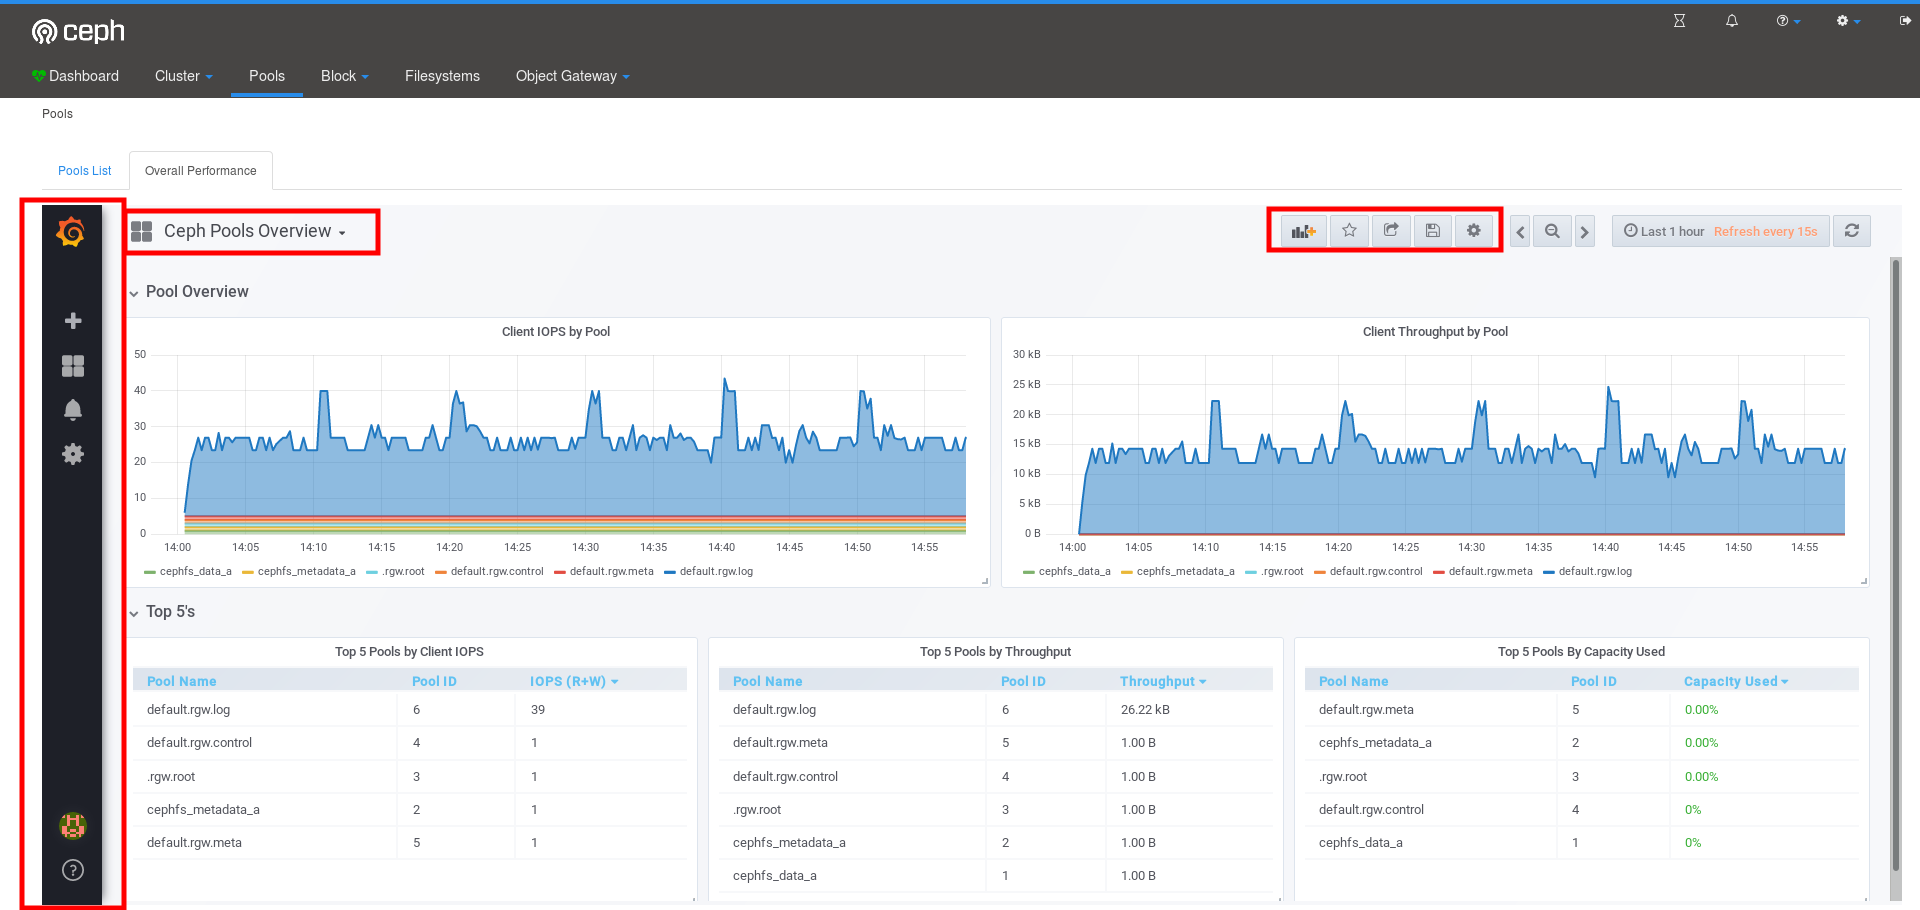
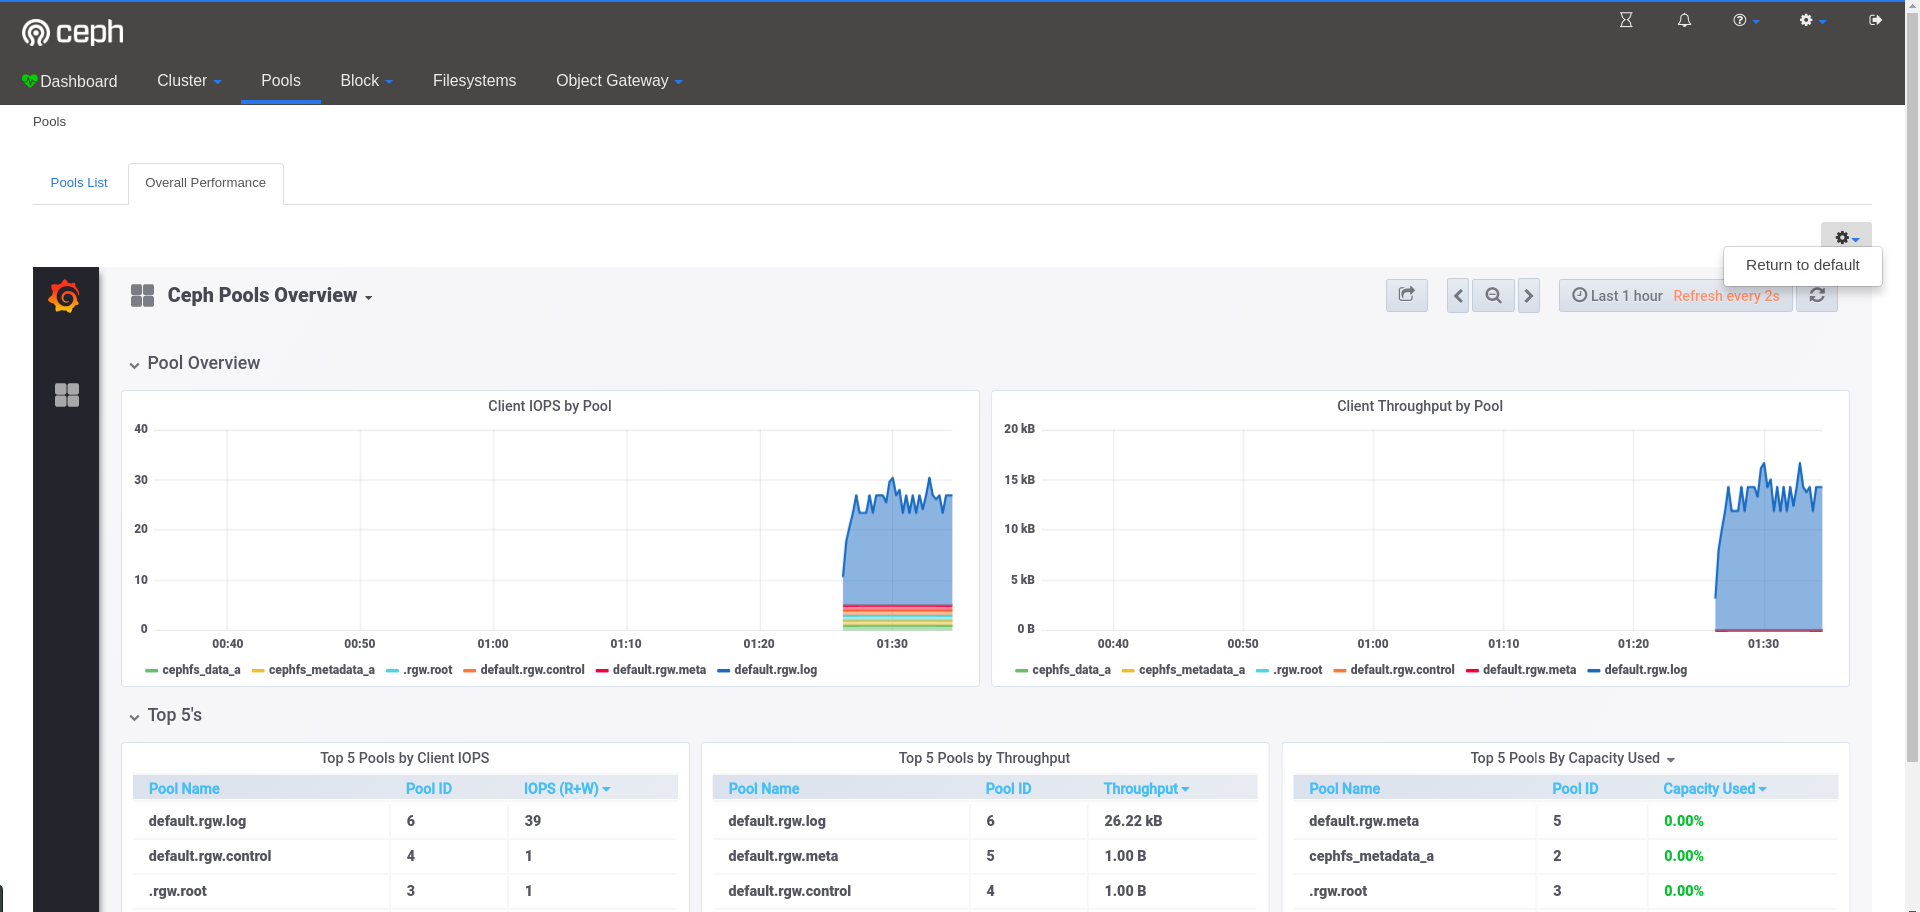
For initial pull request for this, according to suggestions and discussions, we will be going forward will embed Grafana Dashboard in Kiosk mode. Looking like the following:-
Overview:


The button on the extreme right enables the user to toggle from kiosk mode and hence choose a different time picker or reset the dashboard to the original.
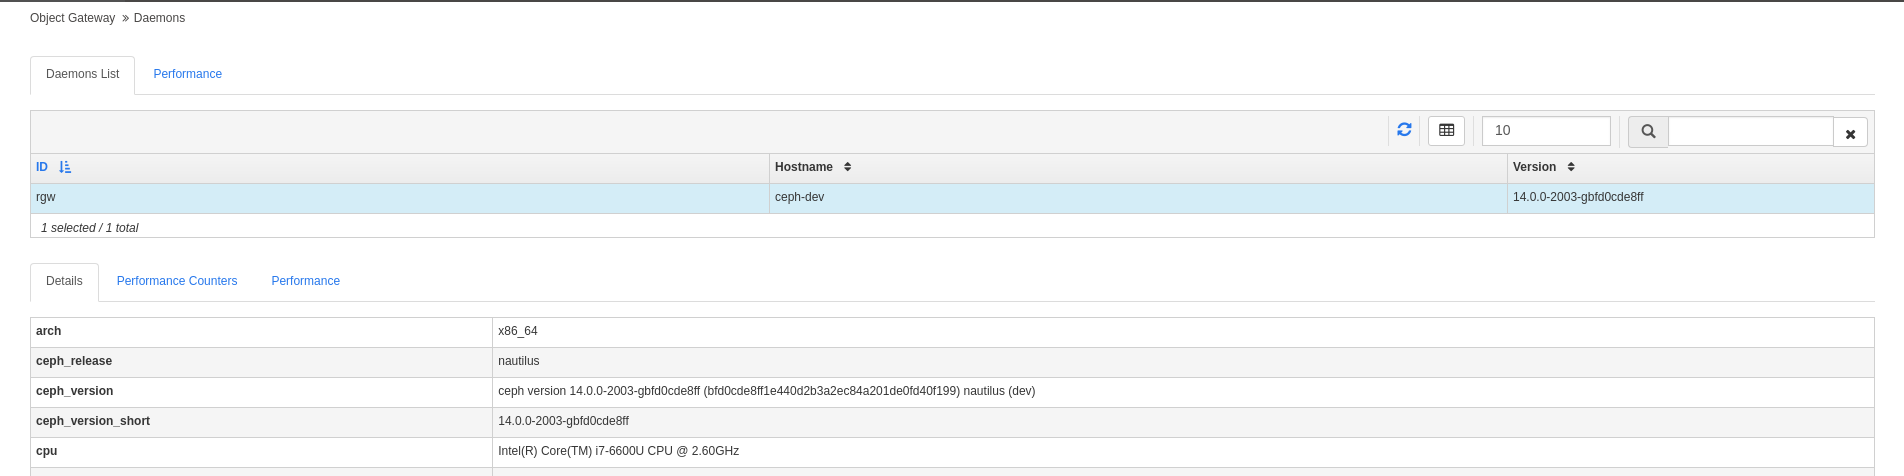
Same for Details:-

Updated by Ricardo Marques over 5 years ago
- Status changed from New to Resolved
Updated by Ernesto Puerta about 3 years ago
- Project changed from mgr to Dashboard