Feature #24625
open
mgr/dashboard: Create dashboard configuration page
Added by Lenz Grimmer almost 6 years ago.
Updated about 3 years ago.
Description
In addition to being able to configure the Ceph Manager Dashboard on the command line, it should be possible to perform the key configuration tasks via a dedicated Configuration page on the dashboard.
This should include:
- RGW settings
- Grafana settings
- Local user/role management / enabling SSO
This page should be reachable via a cog wheel icon in the top right corner of the navigation bar.
Files
Not sure if this would go here, but Paul Cuzner suggested having some Ceph Mgr configuration in the dashboard itself (e.g.: enabled modules).
Ernesto Puerta wrote:
Not sure if this would go here, but Paul Cuzner suggested having some Ceph Mgr configuration in the dashboard itself (e.g.: enabled modules).
I like the idea of the dashboard being able to manage the Ceph Manager as well (in the end, it's a Ceph component like the MONs or OSDs), but I suggest creating a separate issue for that. This issue is primarily about a "Dashboard Settings" page.
Note that there's also issue #24273, which relates to creating the necessary REST API in the backend to make this possible.
- Assignee deleted (
Lenz Grimmer)
- Blocked by Feature #24273: mgr/dashboard: Add backend support for changing configuration settings via the REST API added
- Has duplicate Feature #26892: mgr/dashboard: Add frontend support for changing configuration settings via the web UI added
A bunch of the settings can already be found manager modules page (Cluster -> Manager modules -> Dashboard)
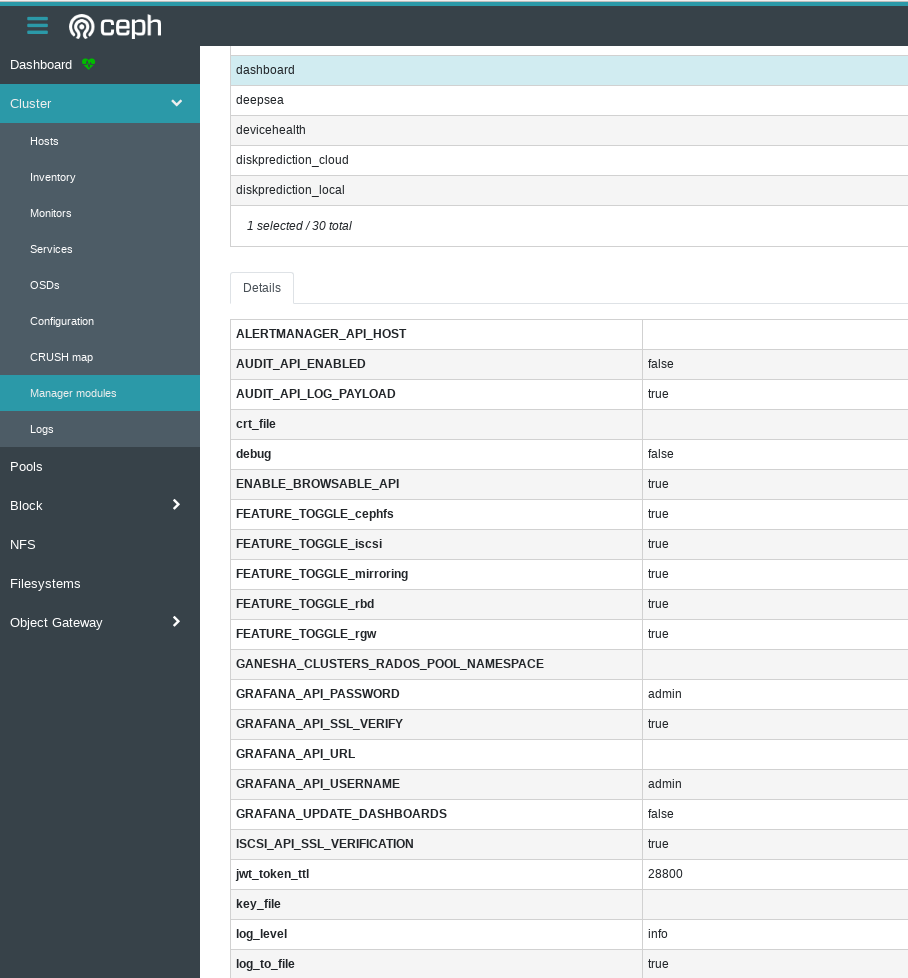
Here is a list of the available settings:
ALERTMANAGER_API_HOST
AUDIT_API_ENABLED
AUDIT_API_LOG_PAYLOAD
crt_file
debug
ENABLE_BROWSABLE_API
FEATURE_TOGGLE_cephfs
FEATURE_TOGGLE_iscsi
FEATURE_TOGGLE_mirroring
FEATURE_TOGGLE_rbd
FEATURE_TOGGLE_rgw
GANESHA_CLUSTERS_RADOS_POOL_NAMESPACE
GRAFANA_API_PASSWORD
GRAFANA_API_SSL_VERIFY
GRAFANA_API_URL
GRAFANA_API_USERNAME
GRAFANA_UPDATE_DASHBOARDS
ISCSI_API_SSL_VERIFICATION
jwt_token_ttl
key_file
log_level
log_to_file
password
PROMETHEUS_API_HOST
REST_REQUESTS_TIMEOUT
RGW_API_ACCESS_KEY
RGW_API_ADMIN_RESOURCE
RGW_API_HOST
RGW_API_PORT
RGW_API_SCHEME
RGW_API_SECRET_KEY
RGW_API_SSL_VERIFY
RGW_API_USER_ID
server_addr
server_port
ssl
ssl_server_port
standby_behaviour
standby_error_status_code
url_prefix
USER_PWD_EXPIRATION_SPAN
USER_PWD_EXPIRATION_WARNING_1
USER_PWD_EXPIRATION_WARNING_2
username
I think it covers most of the Grafana, RGW and user related settings. The user roles can be managed on the user management (User management -> Users -> Roles) page. So the only thing, that's missing from my point of view, is the SSO configuration.
- Related to Feature #44351: mgr: expose Module COMMANDs and metadata in MgrMap::ModuleInfo.module_options added
- Project changed from mgr to Dashboard
- Category changed from 132 to General
Also available in: Atom
PDF