Actions
Bug #36740
closedmgr/dashboard: PG Stats, Pool usage and read/write ops missing from Pools table
Status:
Resolved
Priority:
Normal
Assignee:
Category:
Component - Pools
Target version:
% Done:
0%
Source:
Tags:
Backport:
Regression:
Yes
Severity:
3 - minor
Reviewed:
Description
With the update of the landing page to the new layout (#35691), the list of pools has been removed from the front page. However, the dedicated Pools table is currently missing some vital information that used to be visible on the landing page - it's no longer possible to obtain the current pool's PG status as well as the utilization and I/O operations statistics, which is a regression - this information should still be visible without having to install and configure Grafana and Prometheus.
Compare how this information was displayed before:

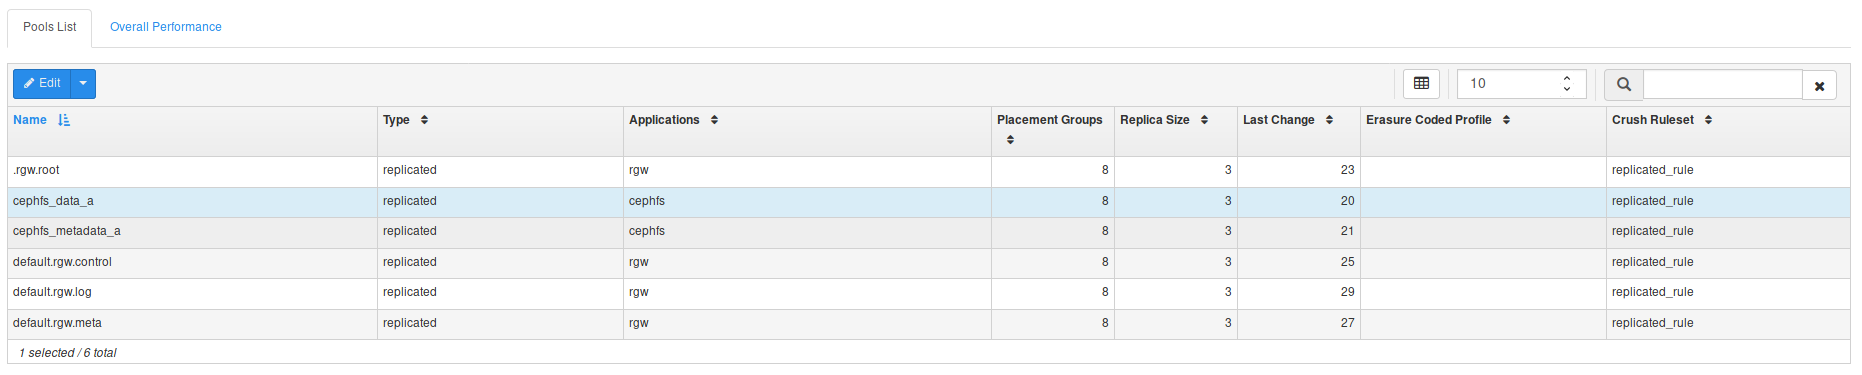
This is how the Pools are currently displayed:
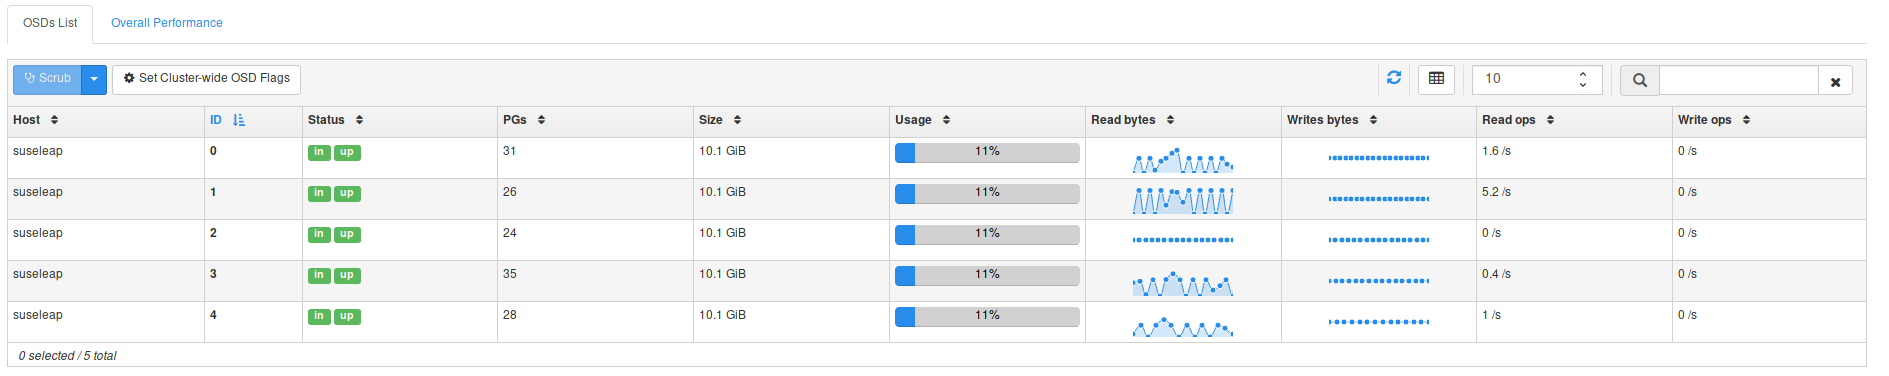
This information should be added to the Pools table, in a similar fashion on how it's implemented on the OSD table:
Files
Actions