Bug #37450
closed
mgr/dashboard: pool fullness graph reports wrong information
Added by Taeyoung Jung over 5 years ago.
Updated about 3 years ago.
Category:
Component - Pools
Description
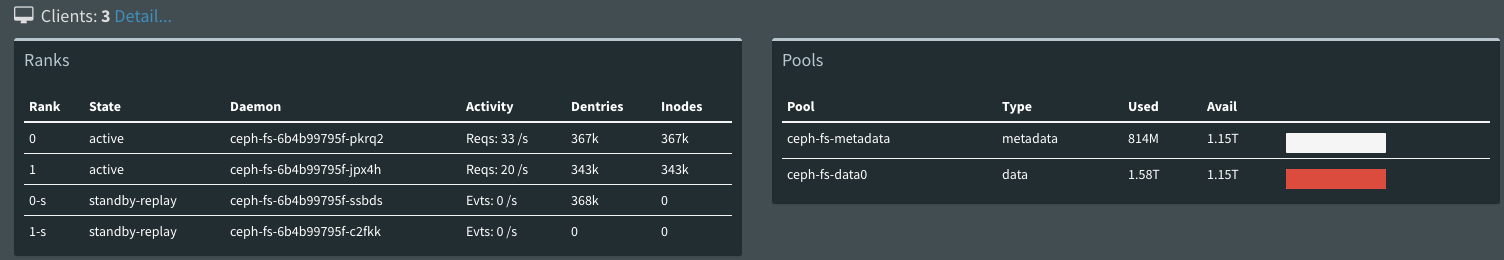
pools panel in filesystem tab in monitor, fullness bar reports how much space is available in visible way.
But since available size is used as total pool size, if half of pool is occupied then fullness bar is fully filled with red which may be meaning no available space.
Files
- Project changed from Ceph to mgr
- Subject changed from pool fullness graph reports wrong information to dashboard pool fullness graph reports wrong information
- Status changed from New to Need More Info
What version of Ceph are you running? Could you please attach a screen shot that visualizes the problem you're facing? I'm not entirely sure I understand.
ceph version is as in below:
- ceph version 12.2.7 (3ec878d1e53e1aeb47a9f619c49d9e7c0aa384d5) luminous (stable)
ceph-monitor1.png is the screenshot and you can see fullness bar is fully filled with red, regardless there's 1.15T available space.
- Subject changed from dashboard pool fullness graph reports wrong information to mgr/dashboard: pool fullness graph reports wrong information
- Category set to 137
- Status changed from Need More Info to New
- Affected Versions v12.2.7 added
- Description updated (diff)
- Status changed from New to Won't Fix
The dashboard development has moved on in the meanwhile, there are no plans to fix bugs in the original dashboard at this point.
- Project changed from mgr to Dashboard
- Category changed from 137 to Component - Pools
Also available in: Atom
PDF