Feature #26954
closedmgr/dashboard: Remove Histogram component
Added by Kanika Murarka over 5 years ago. Updated about 3 years ago.
0%
Description
It is difficult to understand the kind of data represented by Histogram
Files
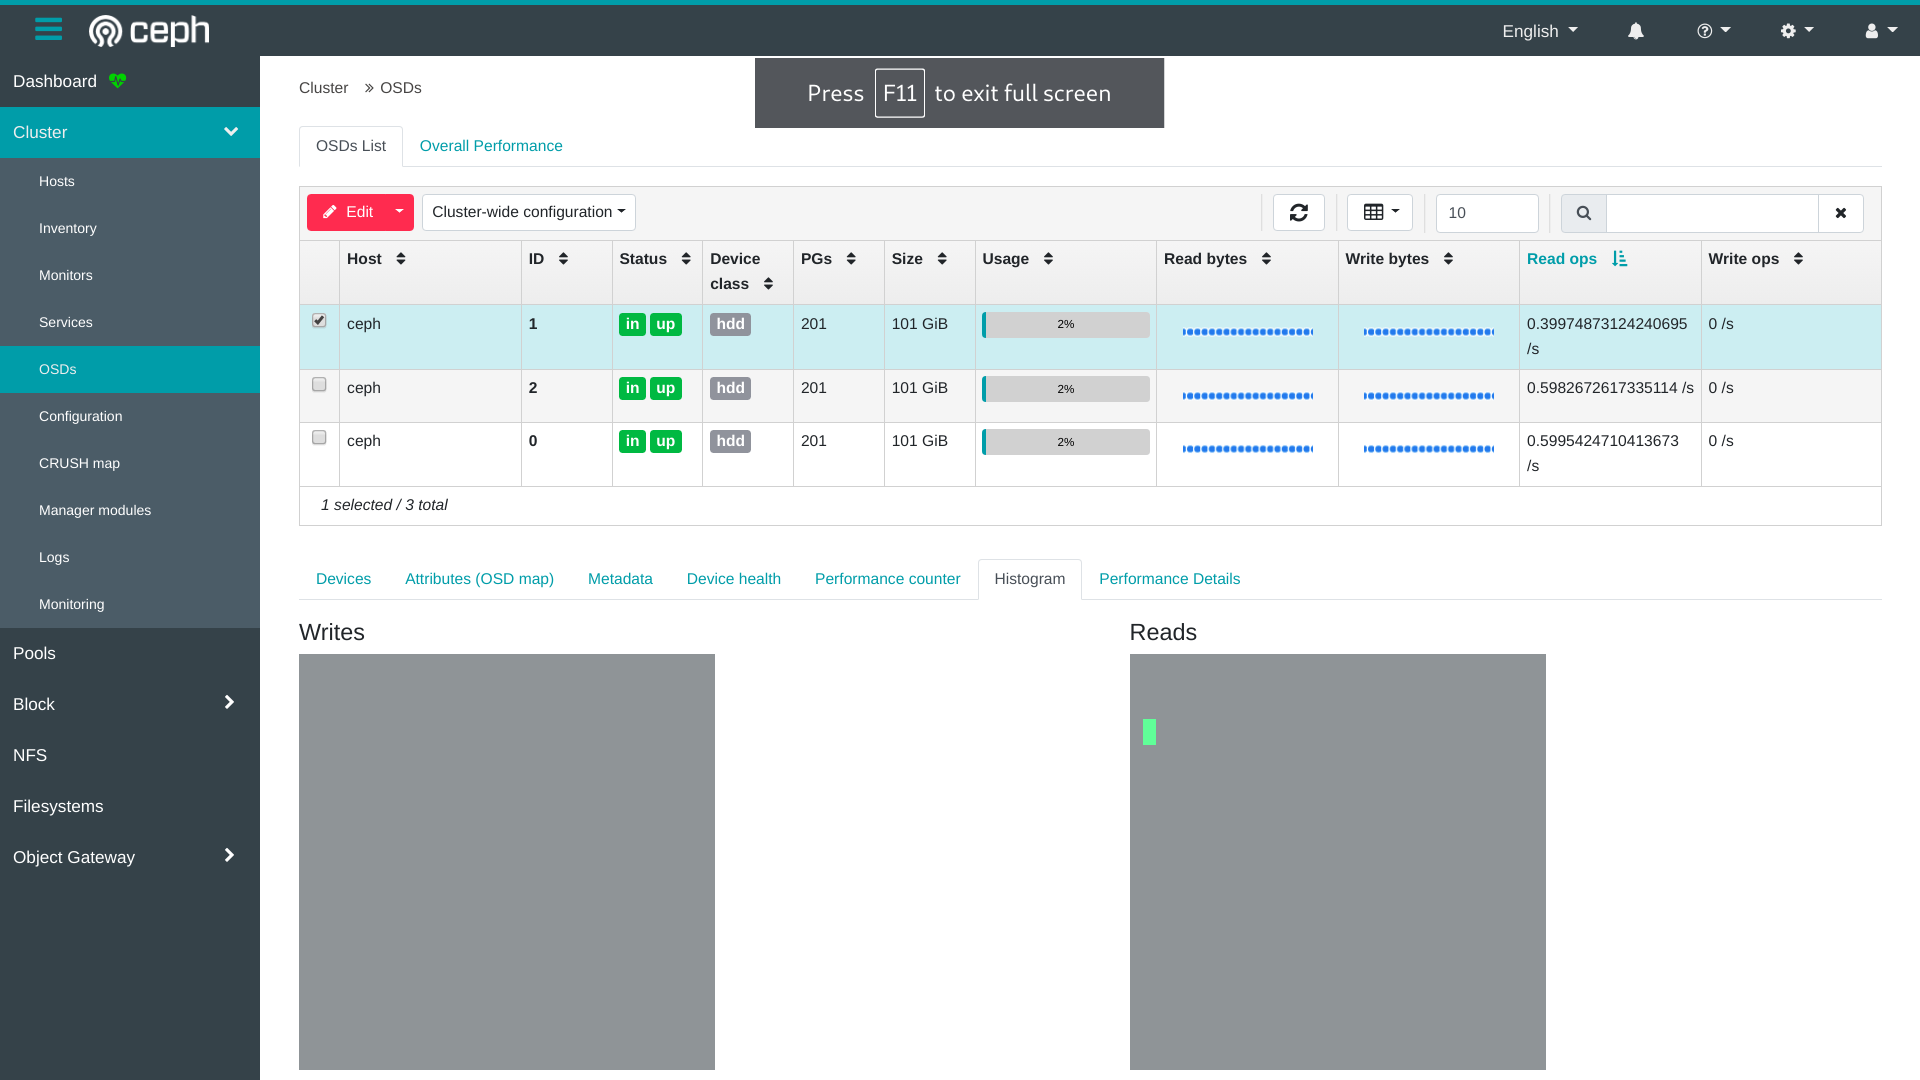
| OSD Details - Historgram.png (52.2 KB) OSD Details - Historgram.png | Cluster >> OSDs - Histogram for a selected OSD | Ju Lim, 08/16/2018 05:42 PM | |
| Screenshot from 2020-04-15 14-17-24.png (150 KB) Screenshot from 2020-04-15 14-17-24.png | Changed colors of the background and blocks | anurag bandhu, 04/16/2020 07:39 AM |
Updated by Ju Lim over 5 years ago
Just attaching a screenshot of the existing "Histogram" details tab for the "Cluster >> OSDs" page when a single OSD is selected in the top table:
There appears to be 2 performance-related detail tabs ("Performance counter" and "Histogram") currently.
With the introduction of the embedded grafana dashboards, there will be yet another tab, i.e. "Performance Details" (if we want to keep label generic) or "OSD Performance".
In looking at the "Histogram" tab, it seems like the data in "Histogram" ought to be reconciled with one of the existing tabs. In looking at Ceph Dashboard v1, it appears that the Histogram was directly on top of the Attributes (OSD map) as an accompaniment.
Some interesting things to note about the "Histogram" is that the red boxes to indicate read/write is not indicative of the OSD status. It's unclear to me what this histogram is showing as there's no tooltip, mouse-over or anything to explain the green pixels moving around (when there are reads and writes).
If the data is of value and makes sense, this histogram probably should be combined into one of the other tabs (Attributes Performance counter), or transformed into something that would be more consumable for the user -- perhaps in the new tab containing the grafana dashboard or with some better explanation as to how to use it. If the data shown in Histogram is not useful and cannot be explained, should we consider removing this tab?
Thoughts?
Updated by Kanika Murarka over 5 years ago
- Subject changed from mgr/dashboard: Histogram lacks description to mgr/dashboard: Histogram on OSD view lacks description
Updated by Lenz Grimmer about 5 years ago
- Has duplicate Cleanup #38948: mgr/dashboard: Replace OSD histogram graphs with something more insightful added
Updated by Lenz Grimmer over 4 years ago
- Translation missing: en.field_tag_list set to usability, monitoring
FWIW, some background information about Perf histograms can be found in the documentation . It also mentions a Python script src/tools/histogram_dump.py that can be used to quickly visualize existing histogram data. I was not able to get this to work, but maybe it would be a good starting point on how to modify the current implementation?
Updated by anurag bandhu about 4 years ago
- Status changed from New to In Progress
Updated by anurag bandhu about 4 years ago
- File Screenshot from 2020-04-15 14-17-24.png Screenshot from 2020-04-15 14-17-24.png added
- Assignee set to anurag bandhu
Changed color of the background
Updated by Tiago Melo over 3 years ago
- Subject changed from mgr/dashboard: Histogram on OSD view lacks description to mgr/dashboard: Remove Histogram component
LenzGr commented on Apr 21
As per our conversation during the standup today, we concluded that the Histogram in it's current form does not really provide any useful information, regardless of the color scheme used. It was decided that we should rather remove the current implementation in its entirety and try to come up with a better solution that visualizes this type of information.
Updated by Aashish Sharma over 3 years ago
- Assignee changed from anurag bandhu to Aashish Sharma
Updated by Ernesto Puerta over 3 years ago
- Precedes Cleanup #46898: mgr/dashboard/api: move/create OSD histogram in separate endpoint added
Updated by Aashish Sharma over 3 years ago
- Status changed from In Progress to Fix Under Review
Updated by Lenz Grimmer over 3 years ago
- Status changed from Fix Under Review to Resolved
- Target version set to v16.0.0
Updated by Ernesto Puerta about 3 years ago
- Project changed from mgr to Dashboard
- Category changed from 138 to Component - OSDs