Project

General

Profile

Actions

Bug #42622

closed

mgr/dashboard: MDS counter chart: We should display the total number of request in the last seconds

Added by Tiago Melo over 4 years ago. Updated about 3 years ago.

Status:
Resolved
Priority:
Normal
Assignee:
Category:
Component - CephFS
Target version:
-
% Done:

0%

Source:
Tags:
Backport:
nautilus
Regression:
No
Severity:
3 - minor
Reviewed:
Affected Versions:
ceph-qa-suite:
Pull request ID:
Crash signature (v1):
Crash signature (v2):

Description

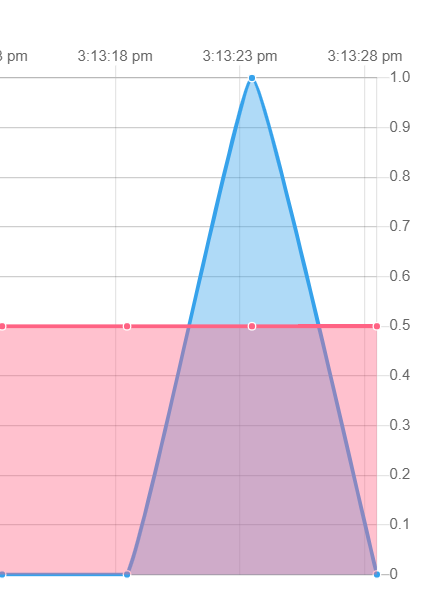
Currently we are showing the number of request per second in the last seconds.
So if we have 1 request in the last 5 seconds, we will display that there was 0.2 client requests.
I think this is a bit confusing and requires the user to know what the time interval is and do mental calculations to know what the real number of requests that were made.


Files

cephfs-before.png (27.9 KB) cephfs-before.png Tiago Melo, 11/04/2019 04:25 PM
cephfs-after.png (20.4 KB) cephfs-after.png Tiago Melo, 11/04/2019 04:25 PM

Related issues 1 (0 open1 closed)

Copied to Dashboard - Backport #43098: nautilus: mgr/dashboard: MDS counter chart: We should display the total number of request in the last secondsResolvedShyukri ShyukrievActions
Actions

Also available in: Atom PDF