Actions
Bug #42622
closedmgr/dashboard: MDS counter chart: We should display the total number of request in the last seconds
% Done:
0%
Source:
Tags:
Backport:
nautilus
Regression:
No
Severity:
3 - minor
Reviewed:
Description
Currently we are showing the number of request per second in the last seconds.
So if we have 1 request in the last 5 seconds, we will display that there was 0.2 client requests.
I think this is a bit confusing and requires the user to know what the time interval is and do mental calculations to know what the real number of requests that were made.
Files
Actions
#1
Updated by Tiago Melo over 4 years ago
- File cephfs-before.png cephfs-before.png added
- File cephfs-after.png cephfs-after.png added
before:
after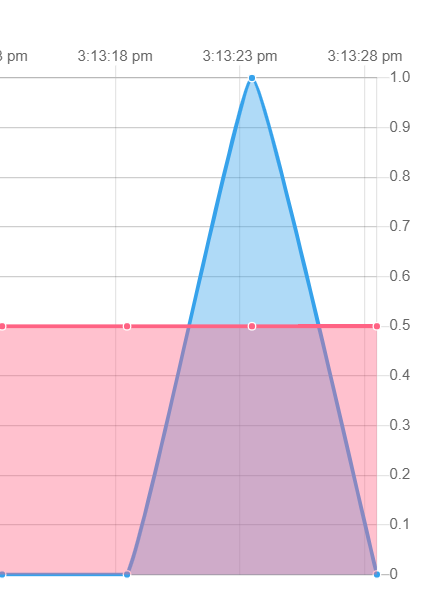
Updated by Tiago Melo over 4 years ago
- Status changed from New to Fix Under Review
- Pull request ID set to 31369
Updated by Tiago Melo over 4 years ago
- Status changed from Fix Under Review to Pending Backport
Updated by Nathan Cutler over 4 years ago
- Copied to Backport #43098: nautilus: mgr/dashboard: MDS counter chart: We should display the total number of request in the last seconds added
Updated by Nathan Cutler almost 4 years ago
- Status changed from Pending Backport to Resolved
While running with --resolve-parent, the script "backport-create-issue" noticed that all backports of this issue are in status "Resolved" or "Rejected".
Updated by Ernesto Puerta about 3 years ago
- Project changed from mgr to Dashboard
- Category changed from 142 to Component - CephFS
Actions