Actions
Feature #41991
openmgr/dashboard: Add hints to explain SMART table data values
Status:
New
Priority:
Normal
Assignee:
-
Category:
Component - OSDs
Target version:
-
% Done:
0%
Source:
Tags:
Backport:
Reviewed:
Affected Versions:
Pull request ID:
Description
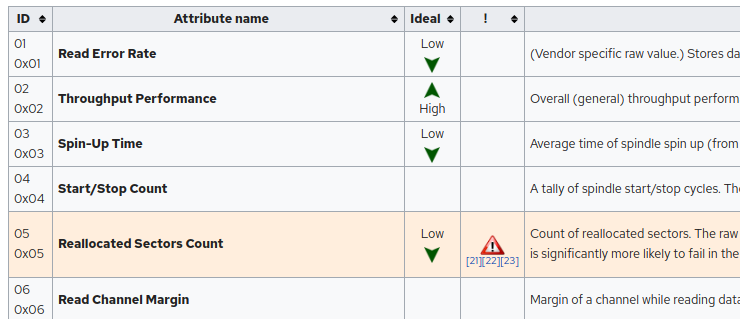
Sometimes people might feel 'overwhelmed' about the amount of data shown. In this case the OSD view displays 6 different tabs, and in the case of the Device Health tab, it brings 2 new nested levels of sub-tabs. It makes sense to display some hints on the data (Wikipedia article for SMART shows some hints), and not only a raw data dump.
It should be our concern, as a dashboard, to display the minimal amount of info required to understand the status of things. By tabulating chunks of uninterpreted data we are losing the chance of making a really big difference compared to just using the CLI.
Files
Updated by Patrick Seidensal over 4 years ago
- Subject changed from mgr/dashboard: Add hints to explain SMART table data to mgr/dashboard: Add hints to explain SMART table data values
Updated by Lenz Grimmer about 4 years ago
- Translation missing: en.field_tag_list set to usability, monitoring, administration
- Assignee deleted (
Patrick Seidensal) - Tags deleted (
usability)
Updated by Ernesto Puerta about 3 years ago
- Project changed from mgr to Dashboard
- Category changed from 138 to Component - OSDs
Actions