Actions
Bug #22142
closedmon doesn't send health status after paxos service is inactive temporarily
% Done:
0%
Source:
Tags:
Backport:
luminous
Regression:
No
Severity:
3 - minor
Reviewed:
Affected Versions:
ceph-qa-suite:
Component(RADOS):
Monitor
Pull request ID:
Crash signature (v1):
Crash signature (v2):
Description
To reproduce:
#start a vstart cluster
../src/vstart.sh -n -s -d
#start the prometheus module for health status, the dashboard shows the same info
bin/ceph mgr module enable prometheus
# confirm healthy cluster state
curl 192.168.178.4:9283/metrics | grep "ceph_health_status 0.0"
# kill a mon and wait a bit for status to change
kill `cat out/mon.a.pid`
sleep 1m
# check of health warn
bin/ceph -s
# mgr modules still show healthy
curl 192.168.178.4:9283/metrics | grep "ceph_health_status 1.0" # 1.0 is warn
curl 192.168.178.4:9283/metrics | grep "ceph_health_status 0.0" # 0.0 is healthy
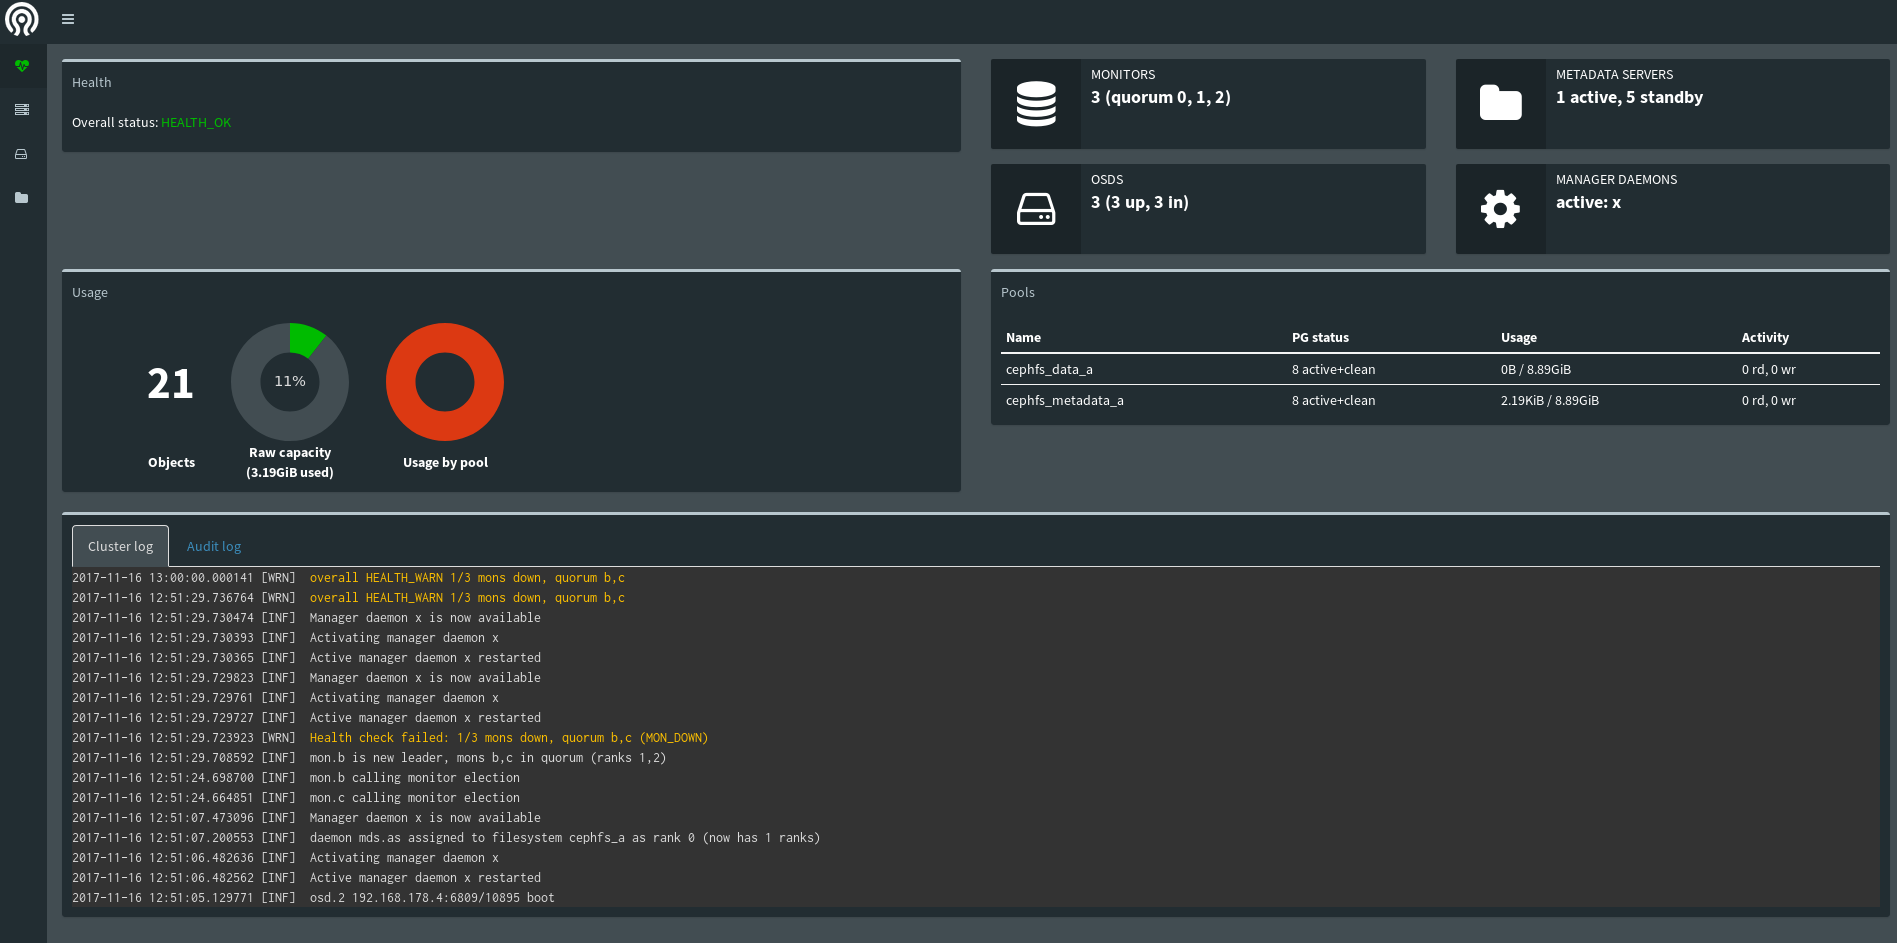
Alternatively check the mgr dashboard (see screenshot).
It seems like sometimes the status propagates correctly, i.e. the dashboard and prometheus module show the WARN state
Files
Actions