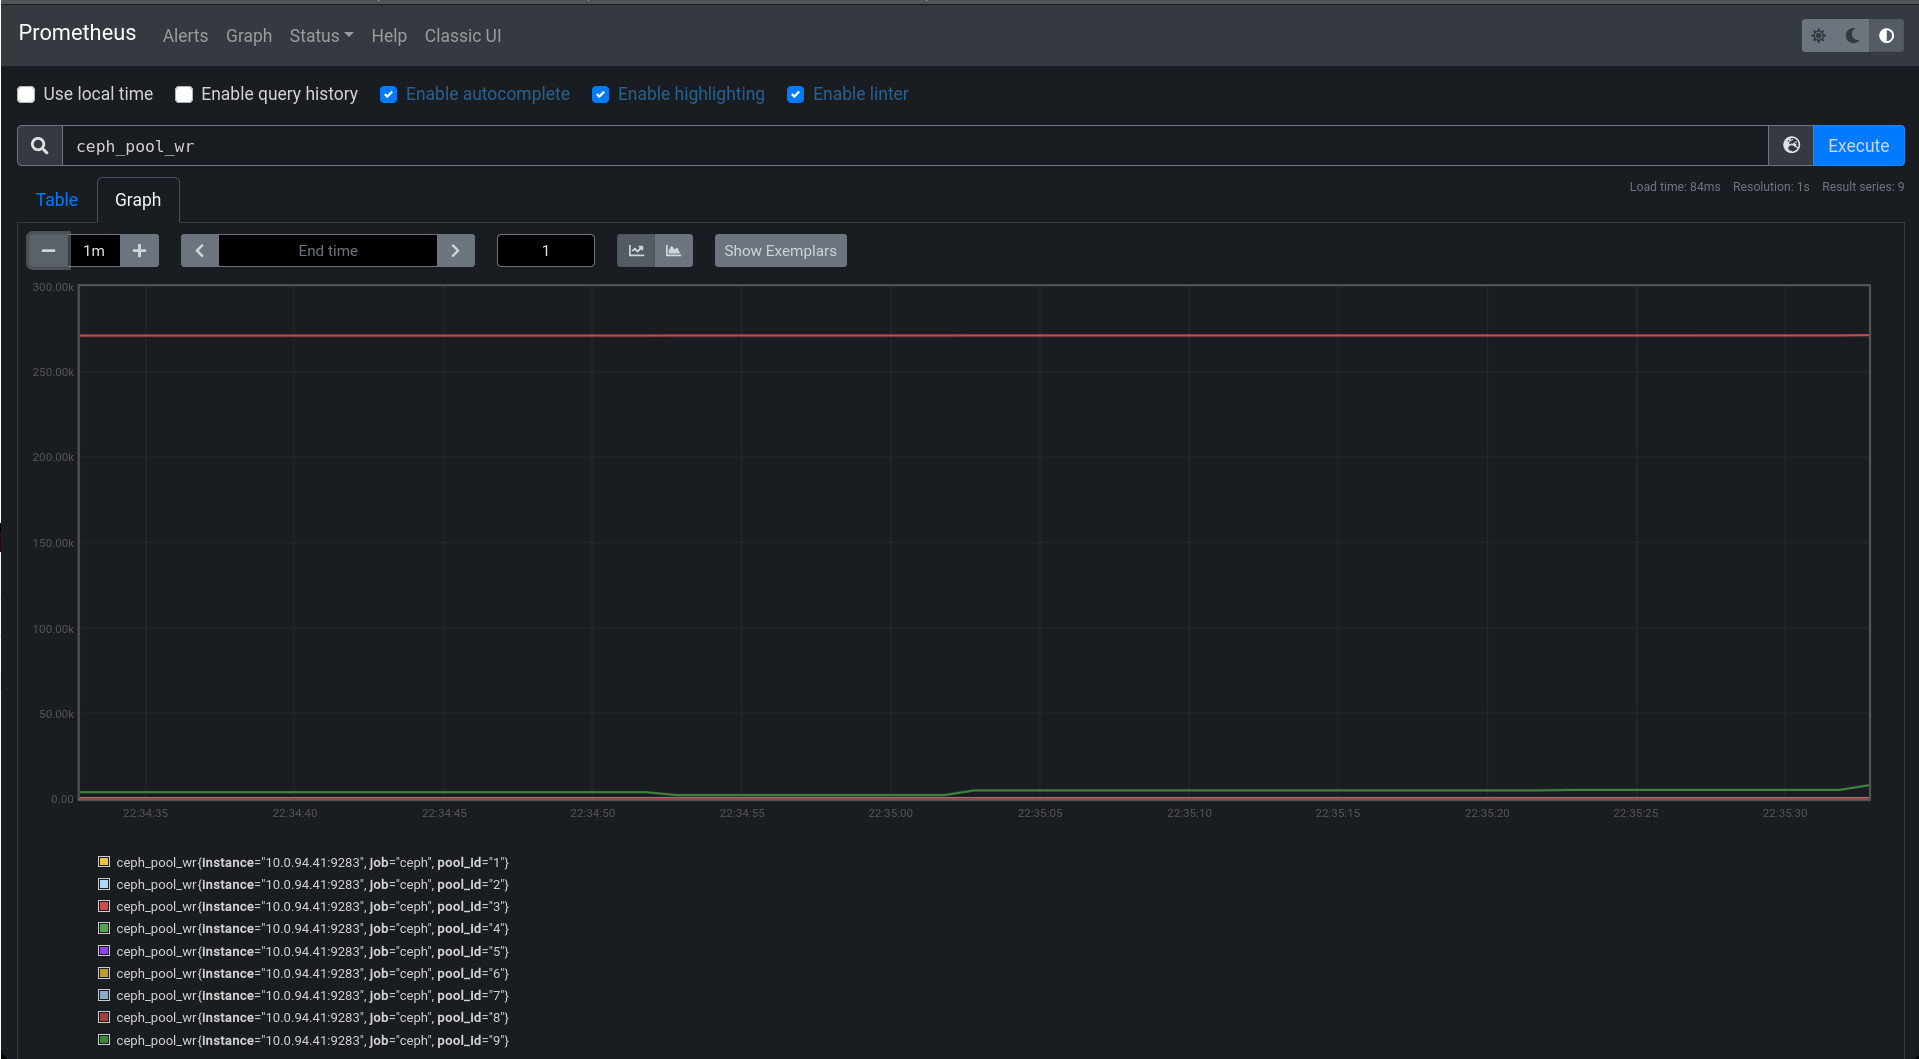
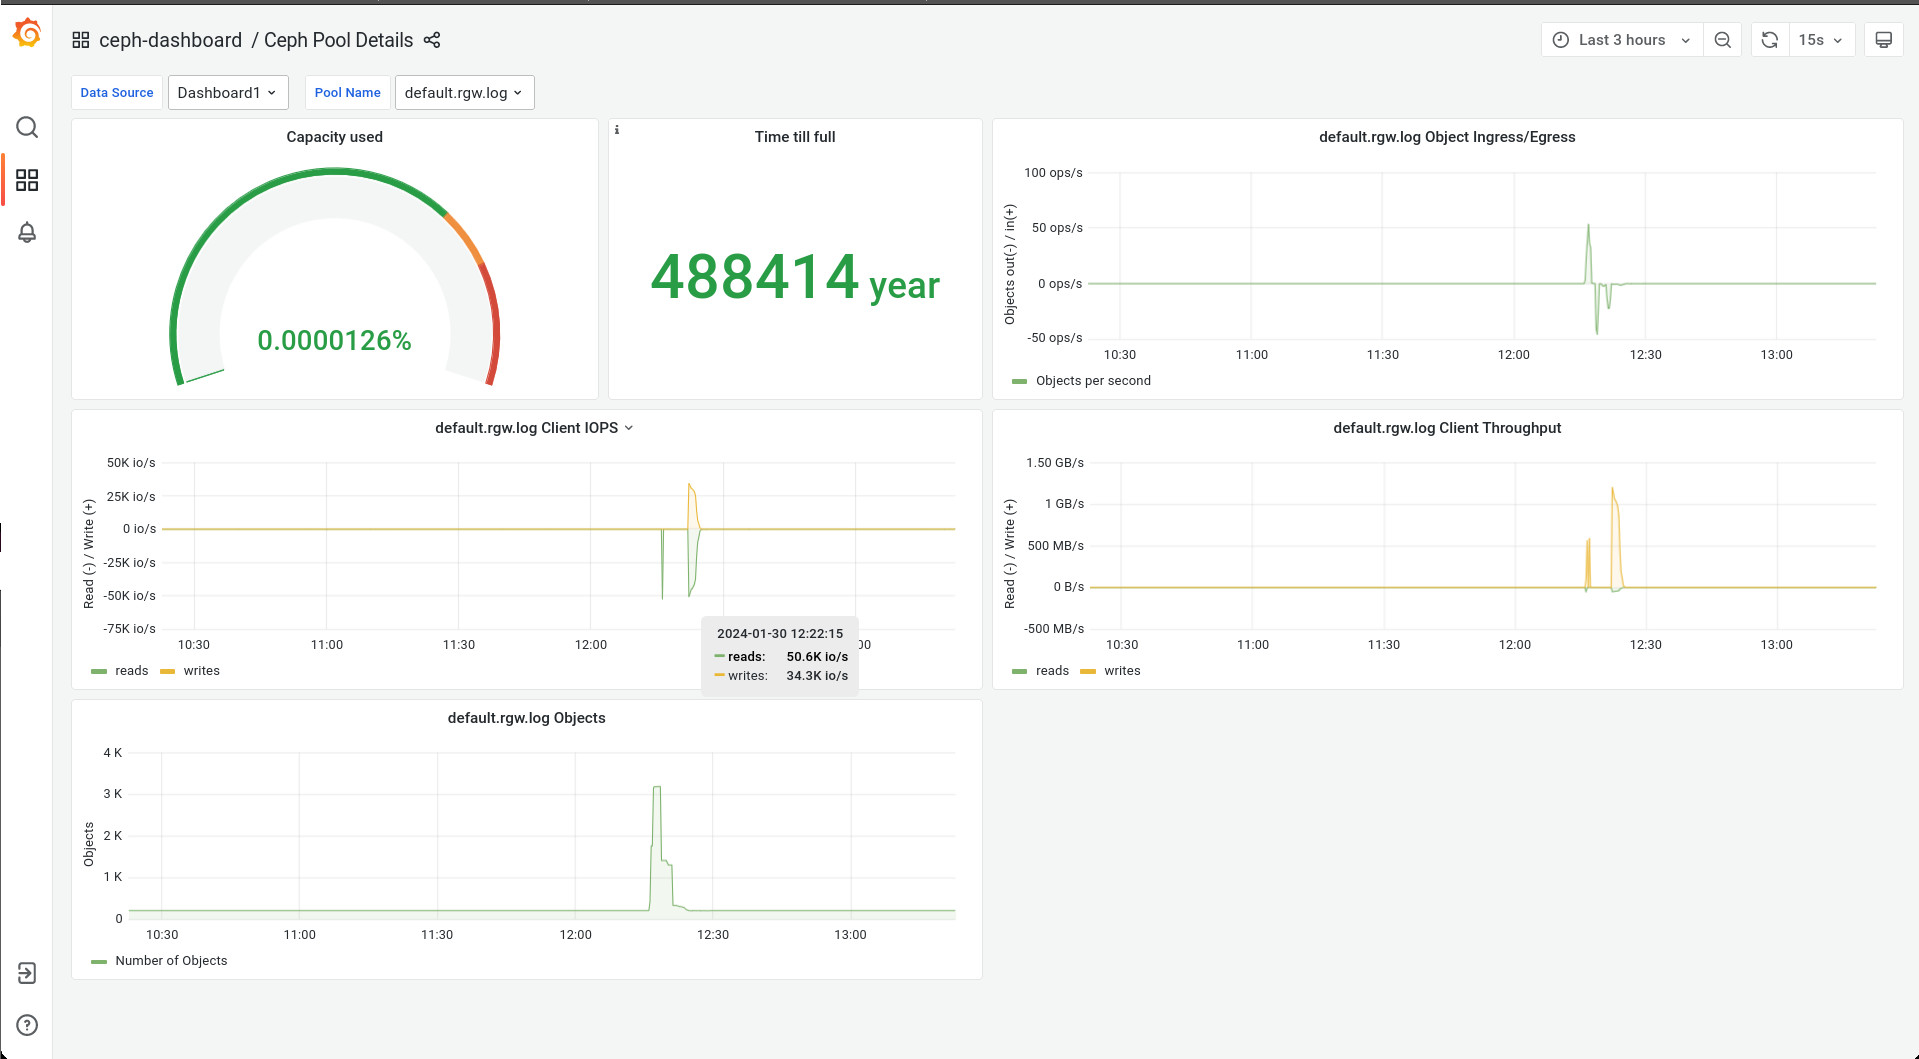
I sense 2 theories behind this bogus IOPS and throughput numbers during cluster recovery.
1. rd/wr/rd_bytes/wr_bytes getting accumulated during cluster recovery and never gets reset for some pools, specially for default.rgw.log pool
pool detail
[root@mgmt-0 ~]# ceph osd pool ls detail
pool 1 '.rgw.root' replicated size 3 min_size 2 crush_rule 0 object_hash rjenkins pg_num 32 pgp_num 32 autoscale_mode on last_change 5198 flags hashpspool stripe_width 0 application rgw
pool 2 'device_health_metrics' replicated size 3 min_size 2 crush_rule 0 object_hash rjenkins pg_num 1 pgp_num 1 autoscale_mode on last_change 5198 flags hashpspool stripe_width 0 pg_num_max 32 pg_num_min 1 application mgr_devicehealth
pool 3 'default.rgw.log' replicated size 3 min_size 2 crush_rule 0 object_hash rjenkins pg_num 160 pgp_num 32 pg_num_target 256 pgp_num_target 256 autoscale_mode on last_change 5198 lfor 0/5135/5197 flags hashpspool stripe_width 0 application rgw
pool 4 'default.rgw.control' replicated size 3 min_size 2 crush_rule 0 object_hash rjenkins pg_num 32 pgp_num 32 autoscale_mode on last_change 5198 flags hashpspool stripe_width 0 application rgw
pool 5 'default.rgw.meta' replicated size 3 min_size 2 crush_rule 0 object_hash rjenkins pg_num 32 pgp_num 32 autoscale_mode on last_change 5198 flags hashpspool stripe_width 0 pg_autoscale_bias 4 application rgw
pool 6 'cephfs_data' replicated size 3 min_size 2 crush_rule 0 object_hash rjenkins pg_num 32 pgp_num 32 autoscale_mode on last_change 5198 flags hashpspool stripe_width 0 application cephfs
pool 7 'cephfs_metadata' replicated size 3 min_size 2 crush_rule 0 object_hash rjenkins pg_num 32 pgp_num 32 autoscale_mode on last_change 5198 flags hashpspool stripe_width 0 pg_autoscale_bias 4 pg_num_min 16 recovery_priority 5 application cephfs
pool 8 'default.rgw.buckets.index' replicated size 3 min_size 2 crush_rule 0 object_hash rjenkins pg_num 32 pgp_num 32 autoscale_mode on last_change 5198 flags hashpspool stripe_width 0 pg_autoscale_bias 4 application rgw
pool 9 'rbd' replicated size 3 min_size 2 crush_rule 0 object_hash rjenkins pg_num 32 pgp_num 32 autoscale_mode on last_change 5198 lfor 0/4584/4582 flags hashpspool stripe_width 0
[root@mgmt-0 ~]# ceph df detail --format=json-pretty|jq '.pools|.[2]'
{
  "name": "default.rgw.log",
  "id": 3,
  "stats": {
    "stored": 3702,
    "stored_data": 3702,
    "stored_omap": 0,
    "objects": 209,
    "kb_used": 408,
    "bytes_used": 417792,
    "data_bytes_used": 417792,
    "omap_bytes_used": 0,
    "percent_used": 0.0000047858416110102553,
    "max_avail": 29099026432,
    "quota_objects": 0,
    "quota_bytes": 0,
    "dirty": 0,
    "rd": 406797,
    "rd_bytes": 416560128,
    "wr": 271046,
    "wr_bytes": 0,
    "compress_bytes_used": 0,
    "compress_under_bytes": 0,
    "stored_raw": 11106,
    "avail_raw": 87297081056
  }
}
default.rgw.log pgid    --> ceph pg <pg> query|jq '.info.stats.stat_sum.num_write'
3.0 --> 11596
3.1 --> 12766
3.2 --> 9134
3.3 --> 10042
3.4 --> 11862
3.5 --> 10920
3.6 --> 10920
3.7 --> 4578
3.8 --> 11286
3.9 --> 6136
3.a --> 14898
3.b --> 5798
3.c --> 9100
3.d --> 13042
3.e --> 7618
3.f --> 11222
3.10 --> 3640
3.11 --> 7618
3.12 --> 5762
3.13 --> 7582
3.14 --> 9170
3.15 --> 5798
3.16 --> 5834
3.17 --> 5492
3.18 --> 5798
3.19 --> 11366
3.1a --> 5834
3.1b --> 2158
3.1c --> 11222
3.1d --> 6100
3.1e --> 9136
3.1f --> 7618
The rd/wr/rd_bytes/wr_bytes does not get reset when cluster is fully recovered. Still need to investigate when these values gets reset.
2. Problem in prometheus query/code representing IOPS/throughput. Prometheus not showing stats in relation to time rather showing IOPS/throughput stats for the pools which are accumulated since start.
The default.rgw.log shows higher IOPS and throughput even though there is no IO on the cluster. All pools are on same crushrule. The rd and wr numbers in ceph df output represents the IOPS for the pool.


