Bug #64119
openDuring OSD recovery, performance stats reported by mgr/prometheus are bogus
0%
Description
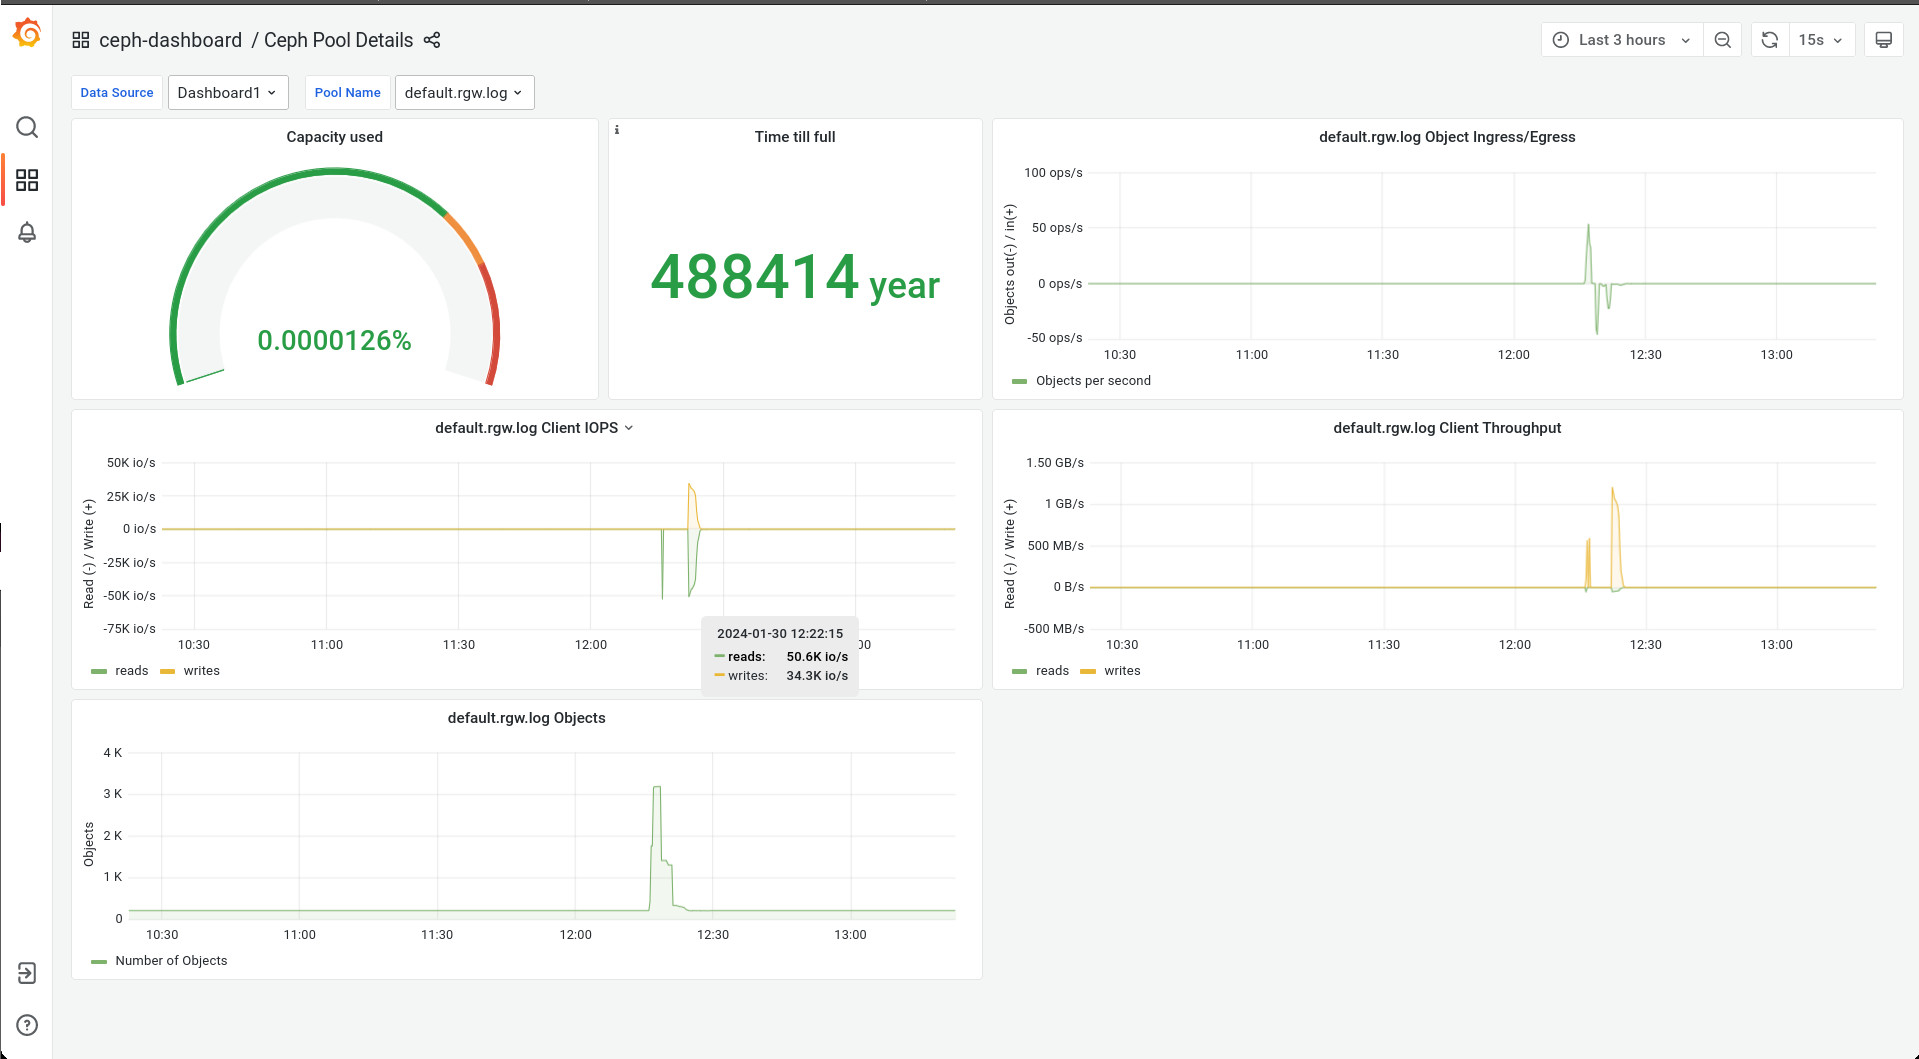
During an OSD recovery period the pool stats can show IOPS and Throughput numbers which do not reflect the state of the systemn.
For example, I've seen IOPS at 175,592,917 and throughput at 9.39TiB/s!
mgr/prometheus us calling the df mgr interface for these stats which appears to call a different internal function (pg_map.dump_pool_stats_full) when compared to the mgr osd_pool_stats call which uses pg_map.dump_pool_stats_and_io_rate
Whilst this is not a major issue, it does pollute any monitoring making the return to normal I/O rate difficult to see within the dashboard and grafana monitoring.
Files
Updated by Prashant D 3 months ago
- File prometheus_pool_default.rgw_log_iops_bogus.jpg prometheus_pool_default.rgw_log_iops_bogus.jpg added
I sense 2 theories behind this bogus IOPS and throughput numbers during cluster recovery.
1. rd/wr/rd_bytes/wr_bytes getting accumulated during cluster recovery and never gets reset for some pools, specially for default.rgw.log pool
pool detail
[root@mgmt-0 ~]# ceph osd pool ls detail
pool 1 '.rgw.root' replicated size 3 min_size 2 crush_rule 0 object_hash rjenkins pg_num 32 pgp_num 32 autoscale_mode on last_change 5198 flags hashpspool stripe_width 0 application rgw
pool 2 'device_health_metrics' replicated size 3 min_size 2 crush_rule 0 object_hash rjenkins pg_num 1 pgp_num 1 autoscale_mode on last_change 5198 flags hashpspool stripe_width 0 pg_num_max 32 pg_num_min 1 application mgr_devicehealth
pool 3 'default.rgw.log' replicated size 3 min_size 2 crush_rule 0 object_hash rjenkins pg_num 160 pgp_num 32 pg_num_target 256 pgp_num_target 256 autoscale_mode on last_change 5198 lfor 0/5135/5197 flags hashpspool stripe_width 0 application rgw
pool 4 'default.rgw.control' replicated size 3 min_size 2 crush_rule 0 object_hash rjenkins pg_num 32 pgp_num 32 autoscale_mode on last_change 5198 flags hashpspool stripe_width 0 application rgw
pool 5 'default.rgw.meta' replicated size 3 min_size 2 crush_rule 0 object_hash rjenkins pg_num 32 pgp_num 32 autoscale_mode on last_change 5198 flags hashpspool stripe_width 0 pg_autoscale_bias 4 application rgw
pool 6 'cephfs_data' replicated size 3 min_size 2 crush_rule 0 object_hash rjenkins pg_num 32 pgp_num 32 autoscale_mode on last_change 5198 flags hashpspool stripe_width 0 application cephfs
pool 7 'cephfs_metadata' replicated size 3 min_size 2 crush_rule 0 object_hash rjenkins pg_num 32 pgp_num 32 autoscale_mode on last_change 5198 flags hashpspool stripe_width 0 pg_autoscale_bias 4 pg_num_min 16 recovery_priority 5 application cephfs
pool 8 'default.rgw.buckets.index' replicated size 3 min_size 2 crush_rule 0 object_hash rjenkins pg_num 32 pgp_num 32 autoscale_mode on last_change 5198 flags hashpspool stripe_width 0 pg_autoscale_bias 4 application rgw
pool 9 'rbd' replicated size 3 min_size 2 crush_rule 0 object_hash rjenkins pg_num 32 pgp_num 32 autoscale_mode on last_change 5198 lfor 0/4584/4582 flags hashpspool stripe_width 0
[root@mgmt-0 ~]# ceph df detail --format=json-pretty|jq '.pools|.[2]'
{
  "name": "default.rgw.log",
  "id": 3,
  "stats": {
    "stored": 3702,
    "stored_data": 3702,
    "stored_omap": 0,
    "objects": 209,
    "kb_used": 408,
    "bytes_used": 417792,
    "data_bytes_used": 417792,
    "omap_bytes_used": 0,
    "percent_used": 0.0000047858416110102553,
    "max_avail": 29099026432,
    "quota_objects": 0,
    "quota_bytes": 0,
    "dirty": 0,
    "rd": 406797,
    "rd_bytes": 416560128,
    "wr": 271046,
    "wr_bytes": 0,
    "compress_bytes_used": 0,
    "compress_under_bytes": 0,
    "stored_raw": 11106,
    "avail_raw": 87297081056
  }
}
default.rgw.log pgid    --> ceph pg <pg> query|jq '.info.stats.stat_sum.num_write'
3.0 --> 11596
3.1 --> 12766
3.2 --> 9134
3.3 --> 10042
3.4 --> 11862
3.5 --> 10920
3.6 --> 10920
3.7 --> 4578
3.8 --> 11286
3.9 --> 6136
3.a --> 14898
3.b --> 5798
3.c --> 9100
3.d --> 13042
3.e --> 7618
3.f --> 11222
3.10 --> 3640
3.11 --> 7618
3.12 --> 5762
3.13 --> 7582
3.14 --> 9170
3.15 --> 5798
3.16 --> 5834
3.17 --> 5492
3.18 --> 5798
3.19 --> 11366
3.1a --> 5834
3.1b --> 2158
3.1c --> 11222
3.1d --> 6100
3.1e --> 9136
3.1f --> 7618
The rd/wr/rd_bytes/wr_bytes does not get reset when cluster is fully recovered. Still need to investigate when these values gets reset.
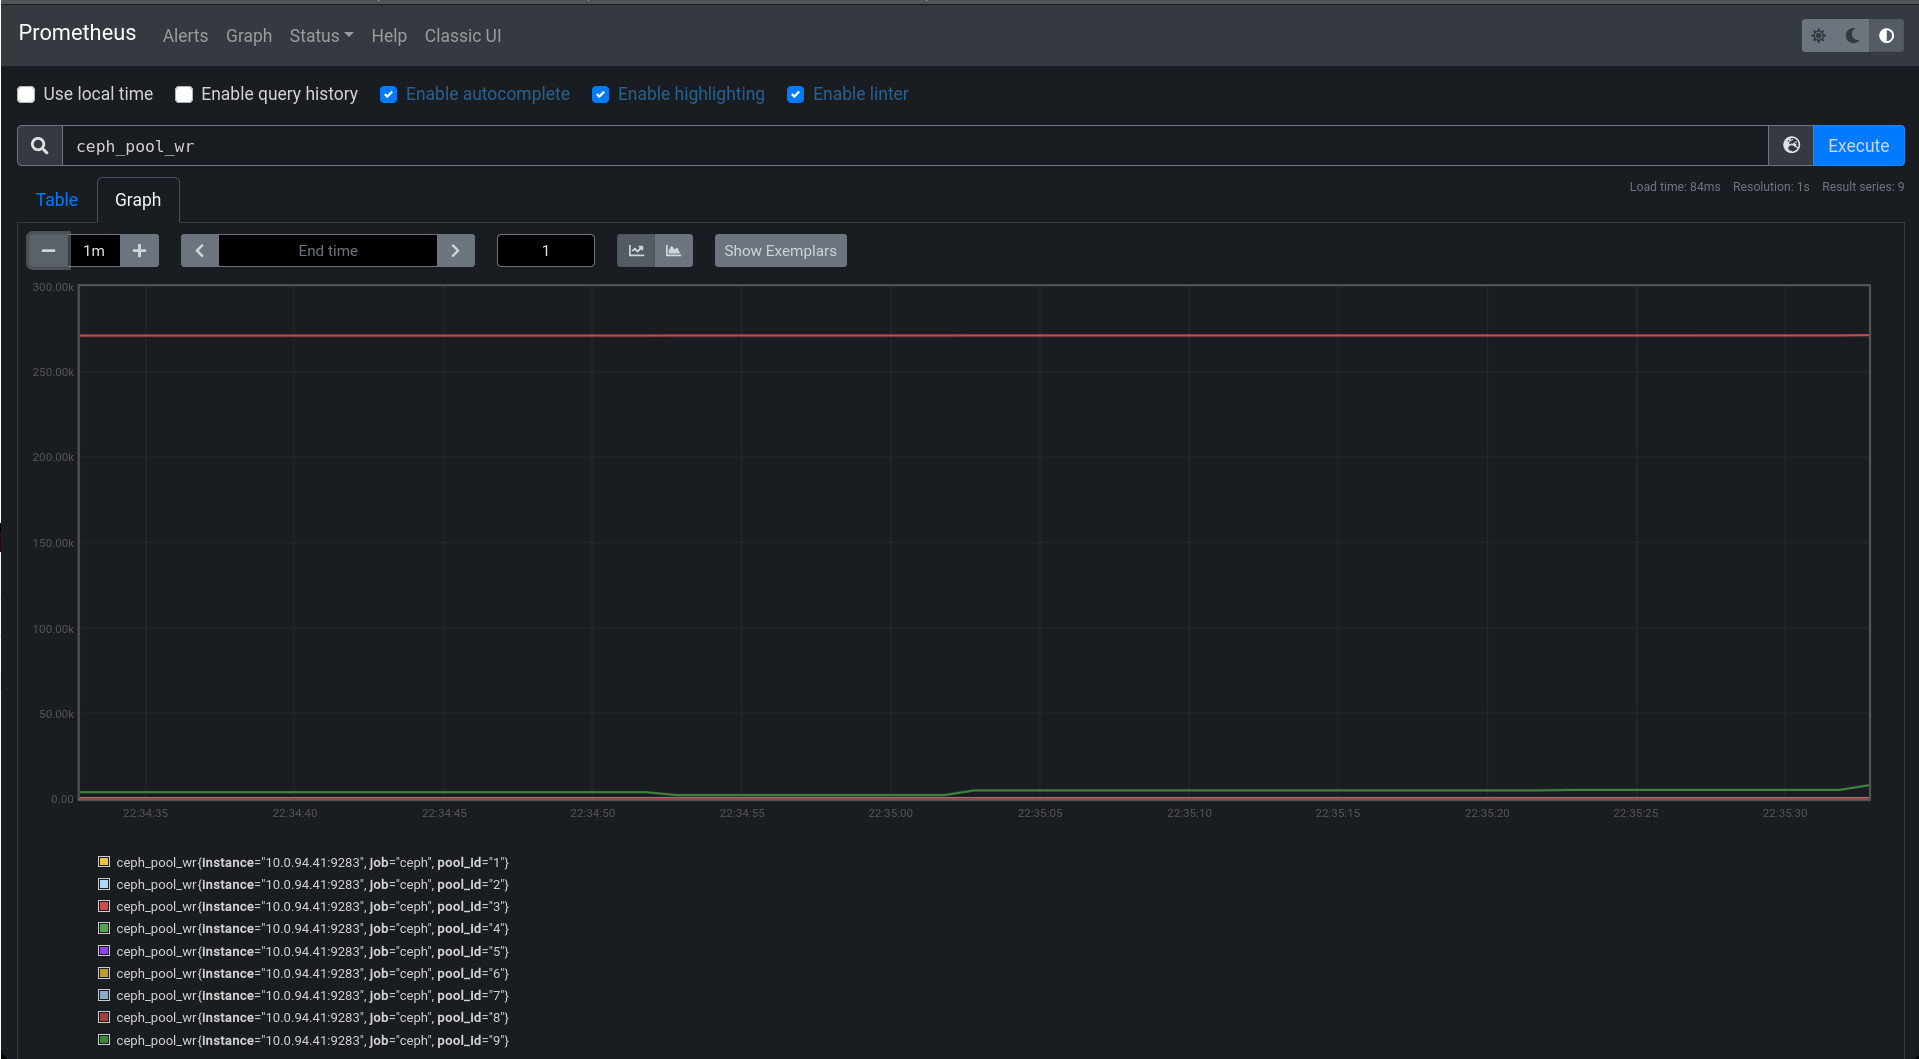
2. Problem in prometheus query/code representing IOPS/throughput. Prometheus not showing stats in relation to time rather showing IOPS/throughput stats for the pools which are accumulated since start.
The default.rgw.log shows higher IOPS and throughput even though there is no IO on the cluster. All pools are on same crushrule. The rd and wr numbers in ceph df output represents the IOPS for the pool.

Updated by Prashant D 3 months ago
Hi Paul,
Would it be possible to provide the graphana dashboard graph when we see inconsistent IOPS and throughput on the cluster during osd recovery ?
Also we will need 5-10 sets of pool stats, ceph df and pg query output captured when we are seeing bogus iops on the cluster :
# for pgid in $(ceph pg ls --format=json-pretty|jq '.pg_stats|.[].pgid'|tr -d '"'); do echo $pgid;ceph pg $pgid query;done > all.pg.query.$(date +%d%b%y_%H-%M-%S).log
# ceph osd pool stats --format=json-pretty > ceph_osd_pool_stats.$(date +%d%b%y_%H-%M-%S).log
# ceph df detail --format=json-pretty > ceph_df_detail.$(date +%d%b%y_%H-%M-%S).log
Also do we see bogus iops on specific pools e.g rgw pools ?
Updated by Paul Cuzner 3 months ago
I think there is a misunderstanding relating to the metrics. The ceph_pool_* metrics are defined as counters which means they always increase - so the promql used to determine current performance uses the rate or irate function in promql to give you the change over the time representation.
If you look at the data returned from a direct scrape (not via prometheus), you'll see the help text that describes the metrics, like this;- HELP ceph_pool_rd_bytes DF pool rd_bytes
- TYPE ceph_pool_rd_bytes counter
ceph_pool_rd_bytes{pool_id="1"} 964608.0
ceph_pool_rd_bytes{pool_id="2"} 152892416.0
This shows that the value for the metric is a counter (always increases), and must therefore use rate/irate to make sense of them. The other common type is gauge - which is simply a point in time value that can be used as is or with functions like deriv() for change over time calculations.
If you have a system where you're performing the tests, I can put a dashboard together there for you. Just met me know.
Updated by Prashant D 3 months ago
Understood. Thanks for the clarification. Let me share my cluster details in DM.
