Bug #64065
open
Dashboard recovery throughput chart is empty
Added by Mark Glines 4 months ago.
Updated 4 months ago.
Description
I have a small cluster of 20 nodes, running reef 18.2.1. It has prometheus and the dashboard enabled.
I just replaced an OSD, and the cluster is currently recovering from that. "ceph status" says this, in the "io:" section:
recovery: 347 MiB/s, 129 objects/s
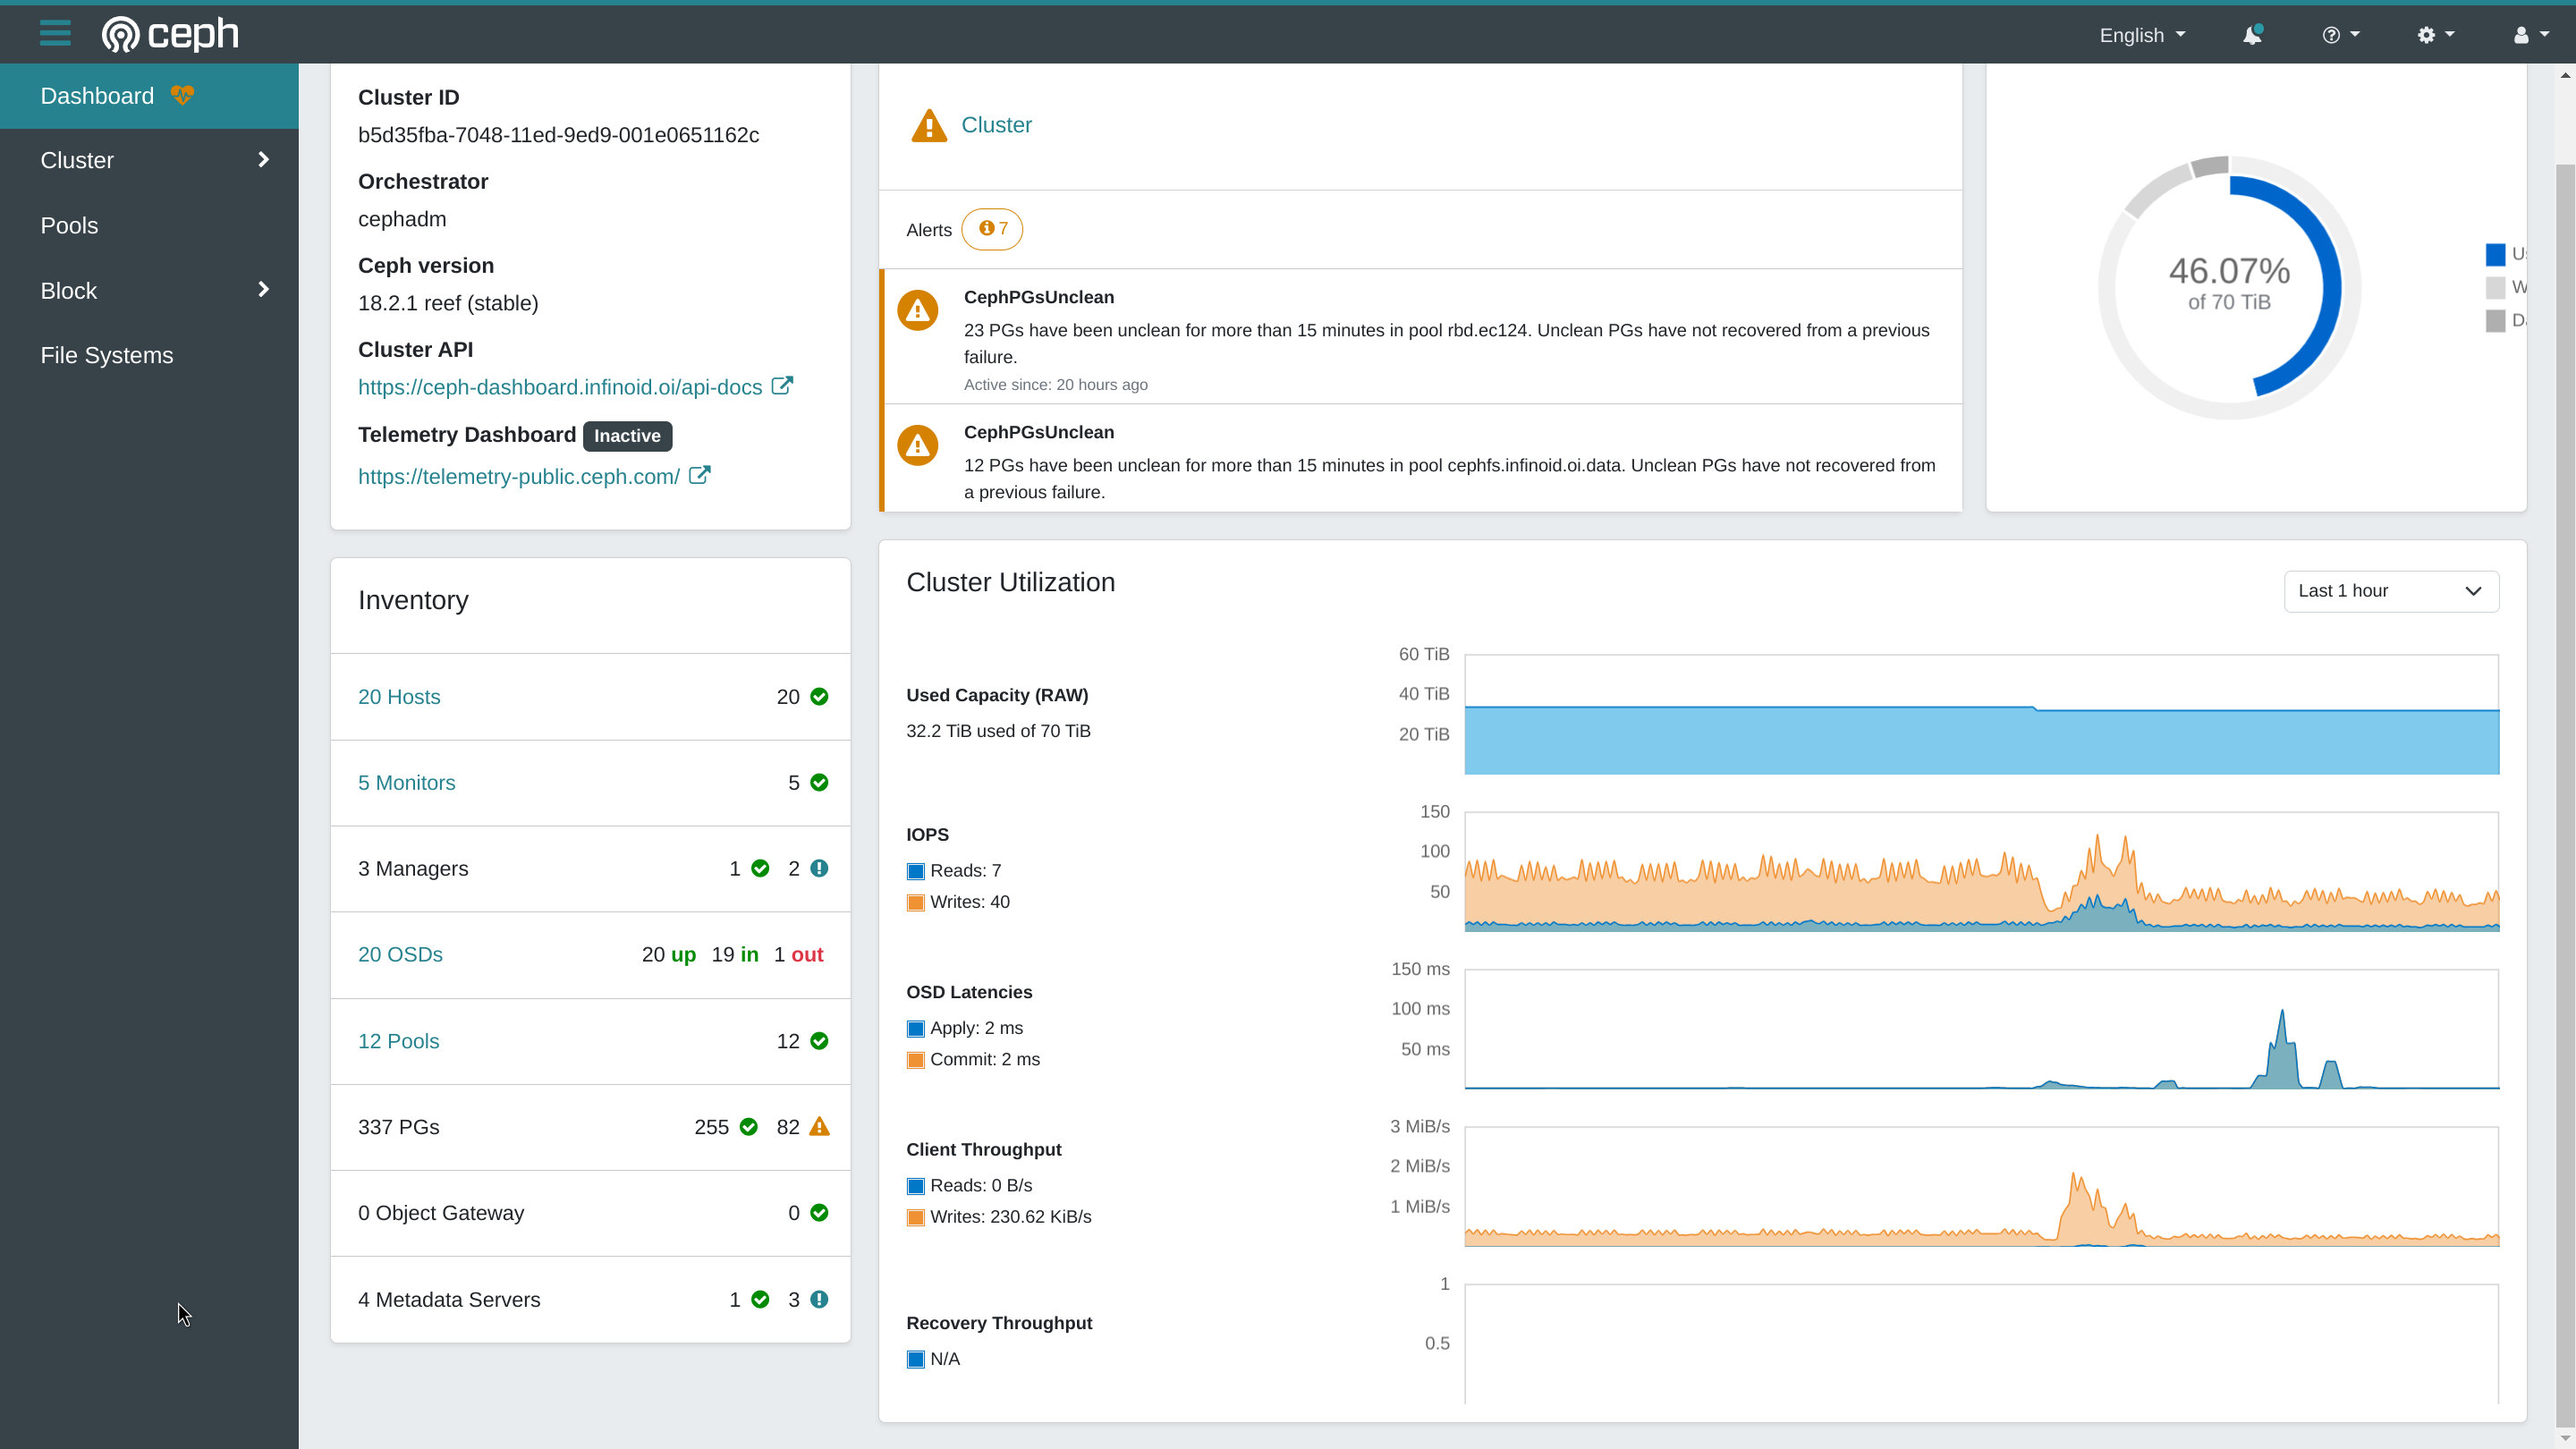
However, the dashboard does not show this recovery throughput. In fact, the recovery graph has never shown anything useful at all. It just says "N/A" with a scale from 0 to 1.
Here is a screenshot.
This cluster was originally installed as Pacific using cephadm, and has been upgraded several times using "ceph orch upgrade".
Files
The metrics pertaining to the mentioned graph are provided by the Prometheus module. I suspect there might be an issue within the module. Could you kindly include the Manager (mgr) logs for further analysis?
Additionally, could you confirm whether you can access `<prometheus_service_url>:9283`? If affirmative, please inspect the `/metrics` endpoint and verify the presence of the metric "recovering_bytes_per_sec."
Sure. By the way, the other charts (like Client Throughput, immediately above) are also dependent on Prometheus, right? I don't know whether this chart would be any different from the others.
My cluster has since finished recovering from that replacement OSD, but I did grab a copy of the Prometheus metrics at the time. Here's the metric you asked for:
# HELP ceph_pool_recovering_bytes_per_sec OSD pool stats: recovering_bytes_per_sec
# TYPE ceph_pool_recovering_bytes_per_sec gauge
ceph_pool_recovering_bytes_per_sec{pool_id="1"} 0.0
ceph_pool_recovering_bytes_per_sec{pool_id="39"} 0.0
ceph_pool_recovering_bytes_per_sec{pool_id="40"} 0.0
ceph_pool_recovering_bytes_per_sec{pool_id="41"} 320938328.0
ceph_pool_recovering_bytes_per_sec{pool_id="42"} 0.0
ceph_pool_recovering_bytes_per_sec{pool_id="43"} 0.0
ceph_pool_recovering_bytes_per_sec{pool_id="44"} 0.0
ceph_pool_recovering_bytes_per_sec{pool_id="45"} 0.0
ceph_pool_recovering_bytes_per_sec{pool_id="46"} 0.0
ceph_pool_recovering_bytes_per_sec{pool_id="47"} 0.0
ceph_pool_recovering_bytes_per_sec{pool_id="48"} 0.0
ceph_pool_recovering_bytes_per_sec{pool_id="49"} 0.0
I have attached a snippet of the active mgr's logs at the time the above screenshot and metrics were taken.
If there are specific things I should search for over a longer time period, please let me know.
In case it's relevant, I think I was running a version of Quincy at the time Prometheus and the dashboard were enabled. Here's the full set of metrics returned by <prometheus_service_url>:9283/metrics.
Also available in: Atom
PDF