Actions
Bug #61720
openmgr/dashboard: embedded grafana dashboards are still using the old 'graph' panel type.
% Done:
0%
Source:
Tags:
backport_processed
Backport:
pacific
Regression:
No
Severity:
3 - minor
Reviewed:
Description
Description of problem
The graph panel type is deprecated, and disappears after Grafana v9.1 (current version is 10.0) to prevent more old type panels being created. The graph panel is used across the following dashboards that are embeded into the ceph-dashboard;
cephfs-overview
hosts-overview
host-details
osd-device-details
osds-overview
pool-detail
pool-overview
radosgw-detail
radosgw-overview
radosgw-sync-overview
rbd-details
rbd-overview
These should be migrated to the timeseries panel type, to avoid potential problems with future Grafana versions.
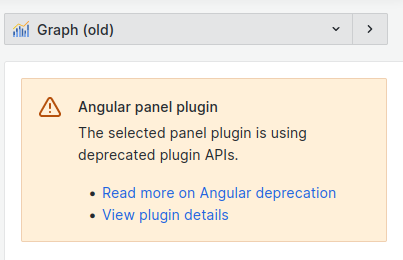
Note: Even on Grafana v10, the visualisation still works, but you see a warning about the panel using a deprecated API when you edit the panel.
Environment
ceph versionstring: 18.1- Platform (OS/distro/release): All
- Cluster details (nodes, monitors, OSDs): Any
- Did it happen on a stable environment or after a migration/upgrade?: Any
- Browser used (e.g.:
Version 86.0.4240.198 (Official Build) (64-bit)): Firefox
How reproducible
N/A
Actual results
N/A
Expected results
N/A
Additional info
N/A
Files
Actions