Actions
Bug #58838
closedmgr/dashboard: POD CPU usage is incorrect
Status:
Resolved
Priority:
Normal
Assignee:
Category:
Component - Services & Daemons
Target version:
% Done:
0%
Source:
Tags:
backport_processed
Backport:
squid, reef, quincy
Regression:
No
Severity:
3 - minor
Reviewed:
Affected Versions:
ceph-qa-suite:
Pull request ID:
Crash signature (v1):
Crash signature (v2):
Description
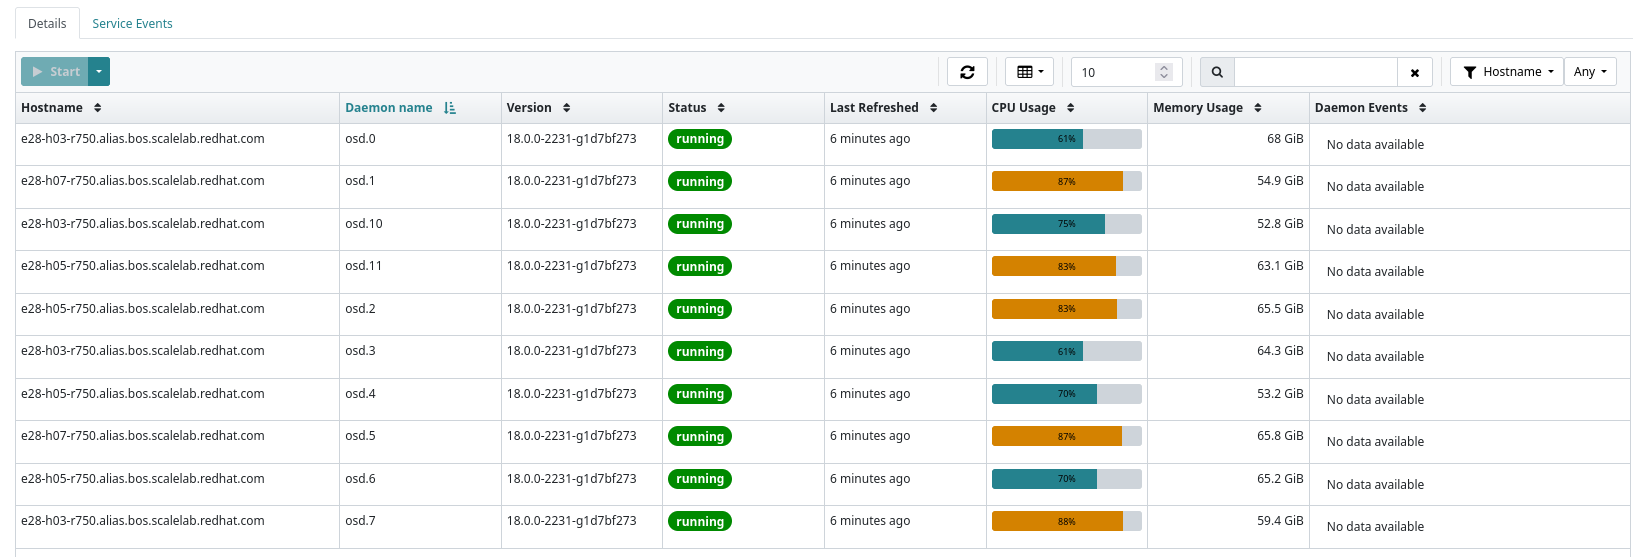
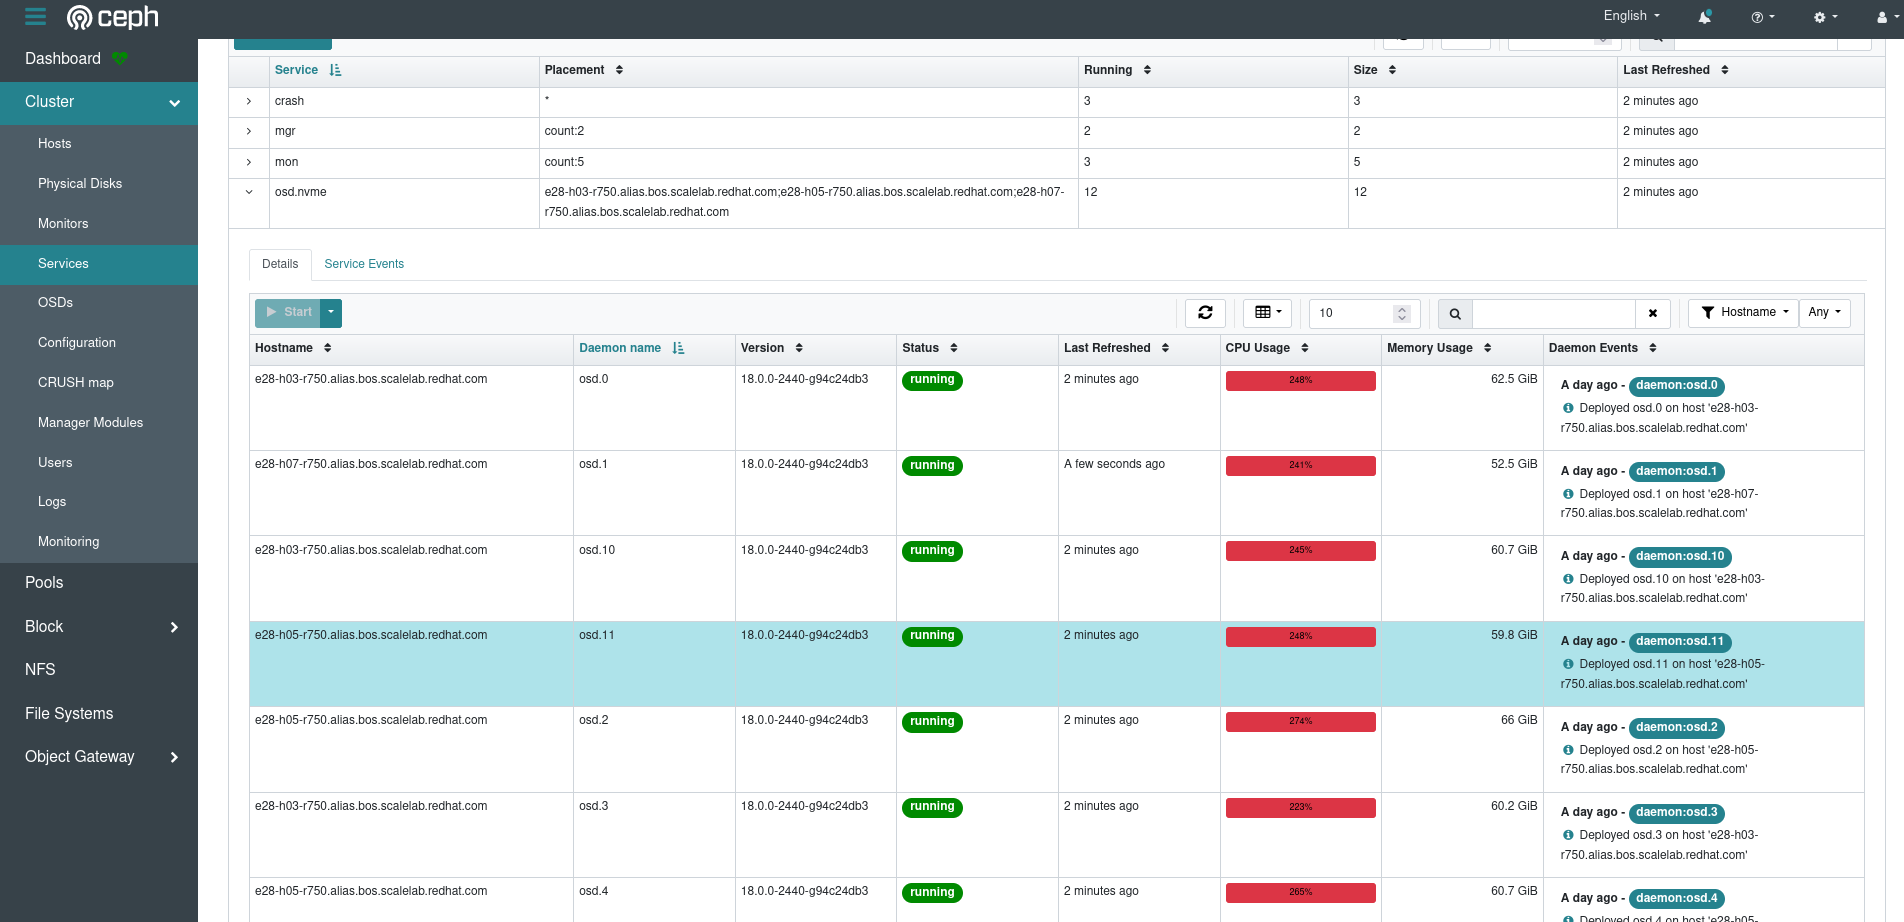
POD CPU usage is incorrectly shown
When looking at the daemons there is a CPU Usage column represented as a bar chart. This appears to show a 0-100% CPU value - but that doesn't make sense since a daemon can span multiple cores. I think the value itself is coming from cephadm ls, which gets it's data from podman stats - and that shows that the CPU % can be > 100
e.g. from podman stats
075960d54f72,130.51%
0a8934ccd5ed,0.00%
33dac47a5ec9,0.00%
4706397fc32c,2.51%
511ddd65d2da,1.07%
64d89a288eab,8.28%
697fc5ed42d0,0.00%
8b508b5262b3,82.94%
9b751f368a44,75.59%
ca78015d90bf,0.00%
e937fd43aa88,104.66%
Environment
ceph versionstring: ceph version 18.0.0-2440-g94c24db3 (94c24db3fe85a6772806e7f8794d74d0408cd734) reef (dev)- Platform (OS/distro/release): RHEL 8.7
- Cluster details (nodes, monitors, OSDs):3 nodes, 3 mons, 12 osds
- Did it happen on a stable environment or after a migration/upgrade?: probably
- Browser used (e.g.:
Version 86.0.4240.198 (Official Build) (64-bit)): Firefox 110
How reproducible
Steps:
- Generate a load against a cluster that drives OSDs to more than one core
- Observe the display
Actual results
Expected results
I don't think this CPU Usage column can realistically be portrayed as a bar chart
Additional info
here
Files
Updated by Paul Cuzner about 1 year ago
Updated by Paul Cuzner about 1 year ago
Updated by Nizamudeen A about 2 months ago
- Status changed from New to Fix Under Review
- Assignee set to Nizamudeen A
- Pull request ID set to 56295
Updated by Nizamudeen A about 1 month ago
- Status changed from Fix Under Review to Pending Backport
- Backport set to squid, reef
Updated by Nizamudeen A about 1 month ago
- Backport changed from squid, reef to squid, reef, quincy
Updated by Backport Bot about 1 month ago
- Copied to Backport #65101: quincy: mgr/dashboard: POD CPU usage is incorrect added
Updated by Backport Bot about 1 month ago
- Copied to Backport #65102: squid: mgr/dashboard: POD CPU usage is incorrect added
Updated by Backport Bot about 1 month ago
- Copied to Backport #65103: reef: mgr/dashboard: POD CPU usage is incorrect added
Updated by Nizamudeen A about 1 month ago
- Status changed from Pending Backport to Resolved
Actions