Bug #52121
closed
mgr/dashboard: replace "Ceph-cluster" Client connections with active-stdby mgrs
Added by Ernesto Puerta over 2 years ago.
Updated over 2 years ago.
Description
Description of problem
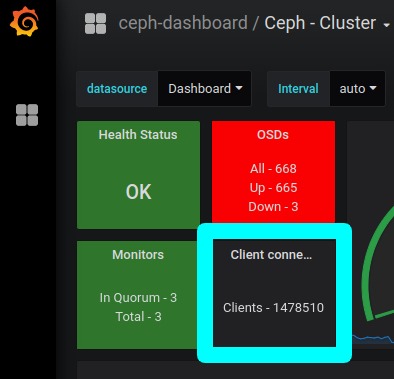
The "Client Connection" box has the following issues:
- It is just MDS/CephFS related (it doesn't show the total number of active connections to the cluster).
- It's an accumulative counter, so the absolute value is not really meaningful.
Environment
ceph version string: all versions
How reproducible
Steps:
Visiting the Ceph-Cluster Grafana Dashboard.
Expected results
A cluster-wide/more meaningful value should be displayed (e.g.: client ops).
Additional info
here
Files
As there's no ceph-wide metric for persistent connections, we could replace it with sum((rate(ceph_mon_session_add[15d]))) by (instance) (the 1-min average of new mon sessions)
- Status changed from New to Triaged
- Target version deleted (
v16.2.6)
- Status changed from Triaged to In Progress
- Assignee changed from Ernesto Puerta to Avan Thakkar
- Pull request ID set to 43377
Update: On discussing with RADOS team proposal is to replace this panel with active-stdby mgrs instead.
- Subject changed from mgr/dashboard: Grafana "Ceph-cluster" Client connections shows a huge/unrealistic value to mgr/dashboard: replace "Ceph-cluster" Client connections with active-stdby mgrs
- Status changed from In Progress to Pending Backport
- Backport set to pacific
- Copied to Backport #52911: pacific: mgr/dashboard: replace "Ceph-cluster" Client connections with active-stdby mgrs added
- Status changed from Pending Backport to Resolved
Also available in: Atom
PDF