Bug #47474
closedmgr/dashboard: share/export grafana dashboards as images
0%
Description
With the currently embedded plugins Grafana fails to export/share images from dashboards

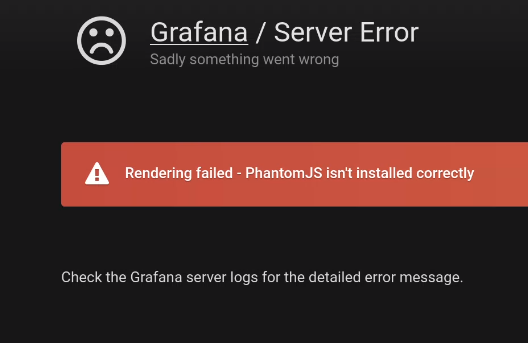
t=2020-09-11T15:42:29+0000 lvl=info msg=Rendering logger=rendering path=d-solo/Vgrwr0IMz/ceph-cluster?
t=2020-09-11T15:42:29+0000 lvl=eror msg="executable not found" logger=rendering executable=/usr/share/grafana/tools/phantomjs/phantomjs
t=2020-09-11T15:42:29+0000 lvl=eror msg="Rendering failed - PhantomJS isn't installed correctly" logger=context userId=1 orgId=1 uname=admin error="PhantomJS executable not found"
t=2020-09-11T15:42:29+0000 lvl=eror msg="Request Completed" logger=context userId=1 orgId=1 uname=admin method=GET path=/render/d-solo/Vgrwr0IMz/ceph-cluster status=500 remote_addr=10.74.8.241 time_ms=2 size=1763 referer=
A plugin providing this functionality is https://grafana.com/grafana/plugins/grafana-image-renderer
Files
Updated by Avan Thakkar over 3 years ago
- File Screenshot from 2020-09-21 14-17-05.png Screenshot from 2020-09-21 14-17-05.png added
- File Screenshot from 2020-09-21 18-09-22.png Screenshot from 2020-09-21 18-09-22.png added
Ernesto Puerta wrote:
With the currently embedded plugins Grafana fails to export/share images from dashboards
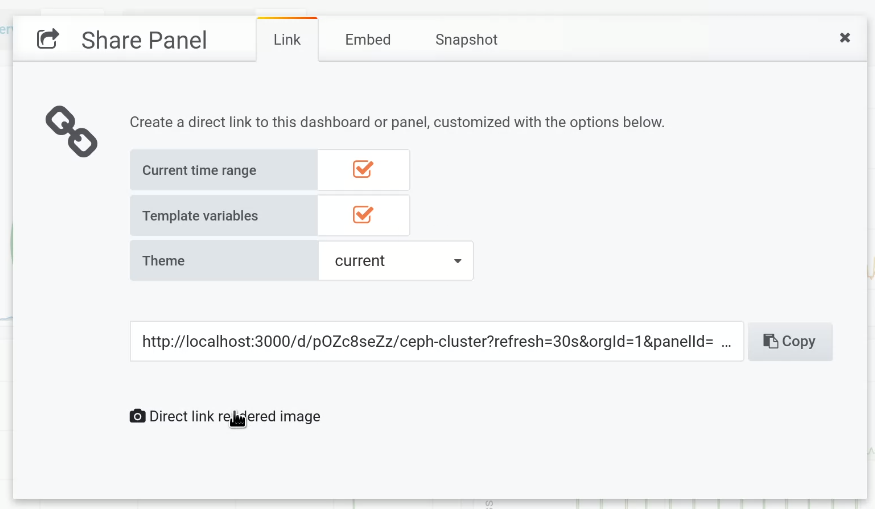
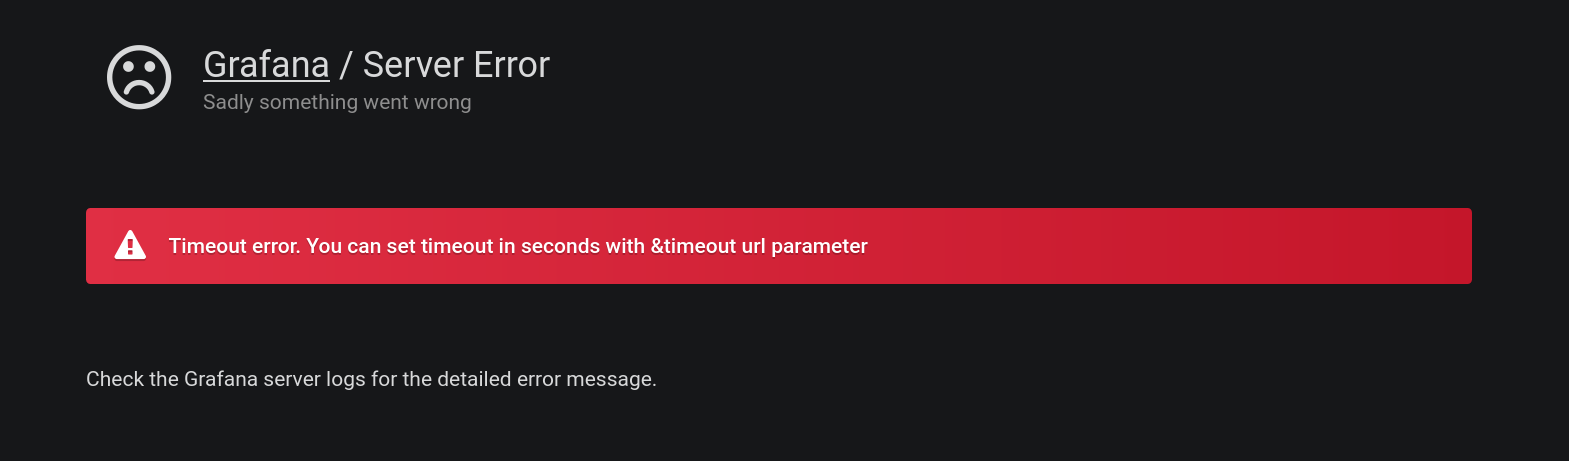
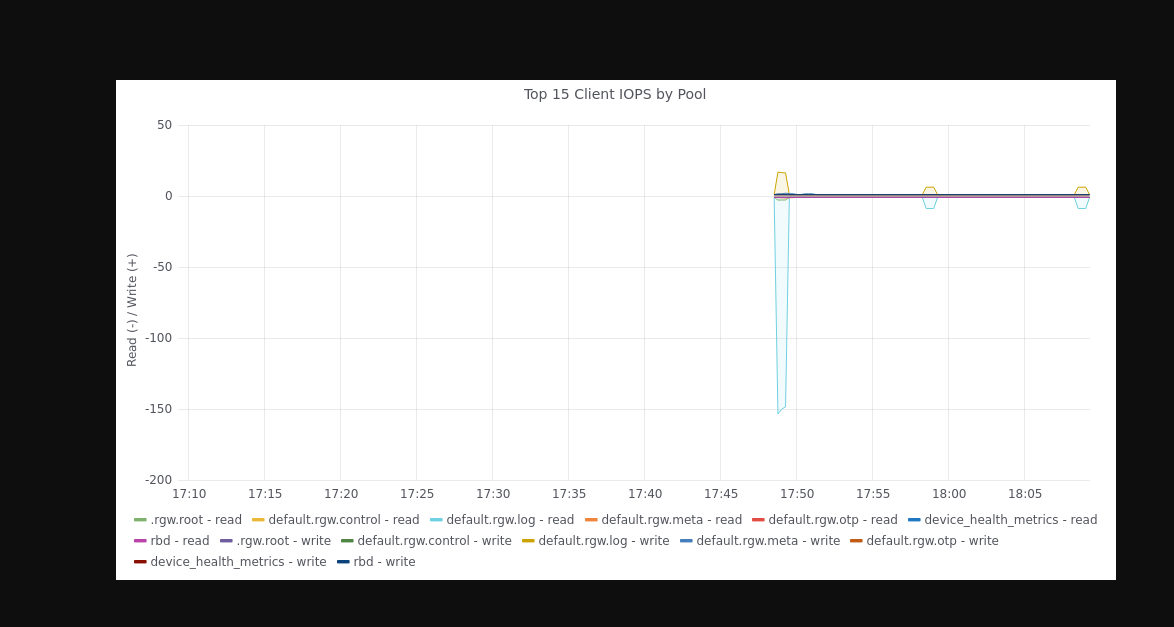
The issue isn't reproducible for the master branch. The grafana dashboards are being able to share/export, except for "Ceph-Cluster" grafana dashboard which is throwing timeout error.
t=2020-09-21T12:34:13+0000 lvl=info msg="Rendering timed out" logger=rendering renderer=phantomJS
t=2020-09-21T12:34:13+0000 lvl=eror msg="Timeout error. You can set timeout in seconds with &timeout url parameter" logger=context userId=0 orgId=1 uname= error="Timeout error. You can set timeout in seconds with &timeout url parameter"
Updated by Avan Thakkar over 3 years ago
Yes and agree with embedding the grafana-image-renderer plugin, following this comment https://community.grafana.com/t/rendering-time-out-without-error/26773
Updated by Lenz Grimmer over 3 years ago
To my knowledge, this is a configuration option that needs to be enabled at build time in Grafana and depends on the PhantomJS headless web browser, which makes the Grafana installation quite "heavy". I'm not sure that's a pure Ceph Dashboard issue.
Updated by Avan Thakkar over 3 years ago
Lenz Grimmer wrote:
To my knowledge, this is a configuration option that needs to be enabled at build time in Grafana
Yes, you are right.
and depends on the PhantomJS headless web browser, which makes the Grafana installation quite "heavy". I'm not sure that's a pure Ceph Dashboard issue.Yes, maybe. I tried embedding the plugin, but it throws "Rendering failed" error, as it's missing some libraries, which seems to be different for different OS as mentioned here https://grafana.com/docs/grafana/latest/administration/image_rendering/#grafana-image-renderer-plugin-and-remote-rendering-service. So maybe this can make installation heavy?!
Updated by Lenz Grimmer over 3 years ago
I suggest to resolve this issue as "Won't fix", as it's primarily a Grafana configuration issue and therefore out of scope for Ceph Dashboard.
Instead, let's create a new feature tracker that implements an option to take a screen shot of an embedded Grafana image using the browser's built-in screen capture API, as Ernesto suggested during today's stand-up.
Updated by Lenz Grimmer over 3 years ago
Lenz Grimmer wrote:
Instead, let's create a new feature tracker that implements an option to take a screen shot of an embedded Grafana image using the browser's built-in screen capture API, as Ernesto suggested during today's stand-up.
Looks as if that API is not really intended to be used for creating still image screen shots of a given browser area. I was not able to find an existing API that support this, but there's some work in progress here: https://github.com/fernap3/screenshot
Updated by Avan Thakkar about 3 years ago
- Related to Feature #49312: mgr/dashboard: screen capture API to share/export grafana dashboards as images added
Updated by Avan Thakkar about 3 years ago
Moving this to Won't Fix as suggested here https://tracker.ceph.com/issues/47474/quoted?journal_id=175546.
Updated by Ernesto Puerta about 3 years ago
- Project changed from mgr to Dashboard
- Category changed from 148 to Monitoring