Actions
Bug #45101
openmgr/dashboard: Grafana validation throws "500 Internal Server Error"
Status:
New
Priority:
Normal
Assignee:
-
Category:
Monitoring
Target version:
-
% Done:
0%
Source:
Community (user)
Tags:
Backport:
Regression:
No
Severity:
4 - irritation
Reviewed:
Affected Versions:
ceph-qa-suite:
Pull request ID:
Crash signature (v1):
Crash signature (v2):
Description
When the dashboard UI does a request to "/api/grafana/validation/XXX" it is getting an 500 response.
Logs only show:
GET] [500] [0.036s] [admin] [513.0B] /api/grafana/validation/z99hzWtmk
Apr 15 14:47:32 mon-1 bash[862]: debug 2020-04-15T12:47:32.773+0000 7f37732c9700  0 [dashboard ERROR request] [b'{"status": "500 Internal Server Error", "detail": "The server encountered an unexpected condition which prevented it from fulfilling the request.", "request_id": "7915a1b7-5eb4-43a6-aba3-0bebde44cb47"}
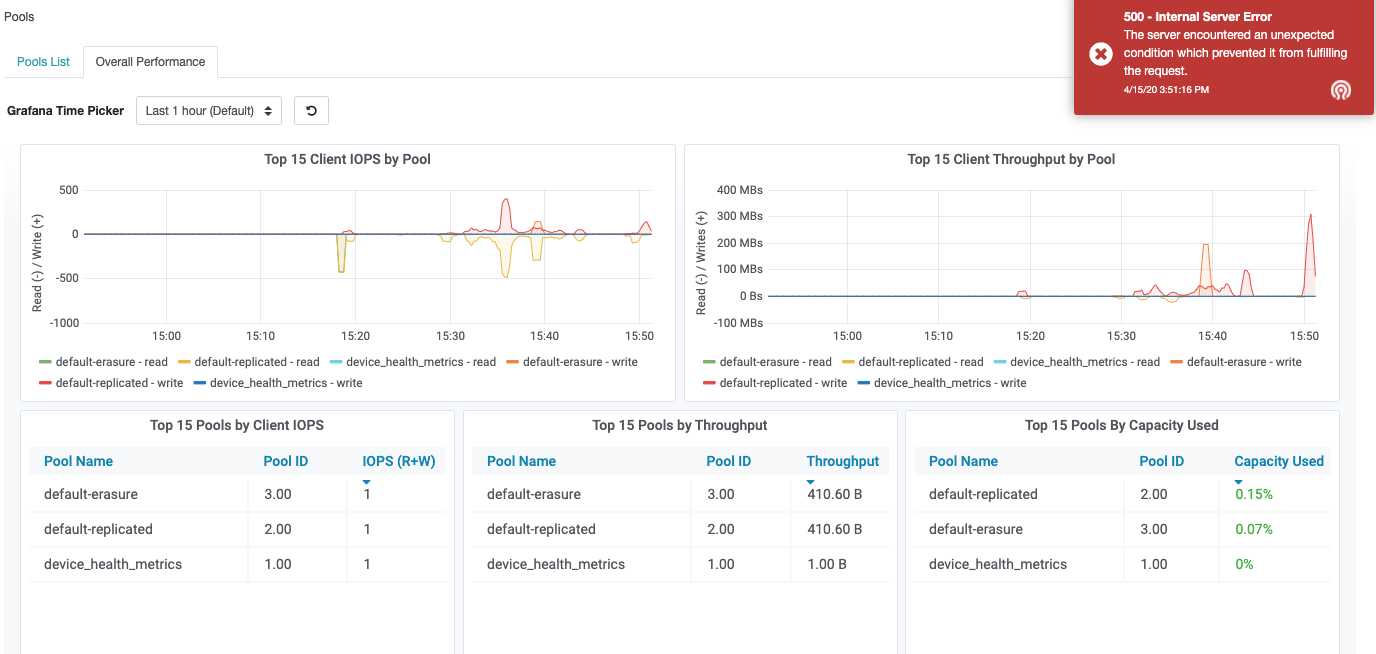
As you can see in WSyAUxJU.png, although the validation fails, the grafana panels are successfully displayed.
Files
Actions