Actions
Feature #40556
openReplace MDS counter chart with Grafana dashboard in Filesystems page
% Done:
0%
Source:
Tags:
Backport:
Reviewed:
Affected Versions:
Pull request ID:
Description
Currently when clicking a fs in Filesystems page, performance counter charts of MDS daemons will be displayed.
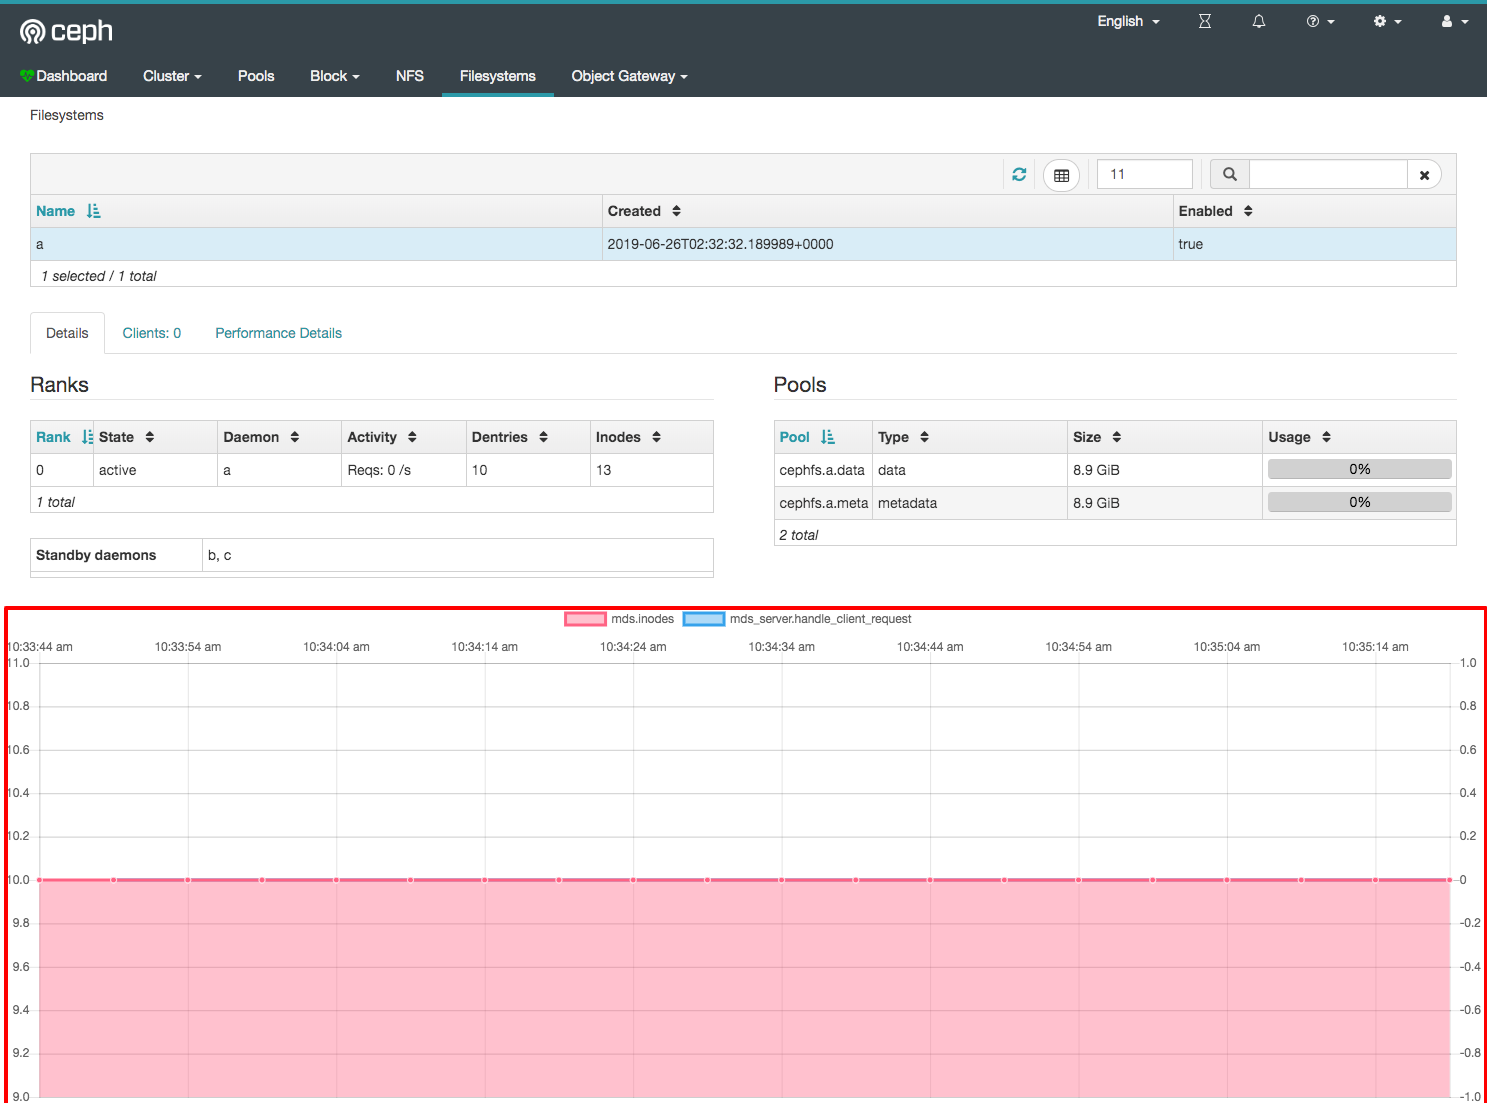
It would be nice to migrate these charts to Grafana dashboard, since fs metrics are exported by Prometheus module.
Example of metrics:
# HELP ceph_mds_mem_dn Dentries
# TYPE ceph_mds_mem_dn gauge
ceph_mds_mem_dn{ceph_daemon="mds.a"} 1354.0
ceph_mds_mem_dn{ceph_daemon="mds.b"} 10.0
ceph_mds_mem_dn{ceph_daemon="mds.c"} 10.0
Files
Updated by Ernesto Puerta about 3 years ago
- Project changed from mgr to Dashboard
- Category changed from 142 to Component - CephFS
Actions