Bug #38745
openspillover that doesn't make sense
0%
Description
BLUEFS_SPILLOVER BlueFS spillover detected on 3 OSD(s)
     osd.50 spilled over 1.3 GiB metadata from 'db' device (20 GiB used of 31 GiB) to slow device
     osd.94 spilled over 1.1 GiB metadata from 'db' device (16 GiB used of 31 GiB) to slow device
     osd.103 spilled over 1.0 GiB metadata from 'db' device (18 GiB used of 31 GiB) to slow device
this is on the sepia lab cluster.
Files
Updated by Chris Callegari about 5 years ago
- File osd5_perf_log.log osd5_perf_log.log added
I recently upgraded from latest mimic to nautilus. My cluster displayed 'BLUEFS_SPILLOVER BlueFS spillover detected on OSD'. It took a long conversation and a manual scan of all my osds to find the culprit. The '/usr/bin/ceph daemon osd.5 perf dump | /usr/bin/jq .' output is attached. Unfortunately I did not let this osd hang around for a long time. I zapped and created him.
Thanks,
/Chris Callegari
Updated by Chris Callegari about 5 years ago
Also my cluster did not display the 'osd.X spilled over 123 GiB metadata from 'blah' device (20 GiB used of 31 GiB) to slow device"
Updated by Igor Fedotov about 5 years ago
Chris Callegari wrote:
Also my cluster did not display the 'osd.X spilled over 123 GiB metadata from 'blah' device (20 GiB used of 31 GiB) to slow device"
Chris, you should invoke "ceph health detail" to get such an output.
Updated by Igor Fedotov about 5 years ago
Generally I suppose this is a valid state - RocksDB put next level data to slow device when it expects it wouldn't fit into the fast one. Please recall that RocksDB uses 250MB as a level base size and 10 as a next level multiplier by default. So drive has to have 250+GB to fit L3.
Updated by Sage Weil about 5 years ago
I tried a compaction on osd.50. Before,
osd.50 spilled over 1.3 GiB metadata from 'db' device (18 GiB used of 31 GiB) to slow device
compaction showed:
2019-03-25 14:46:13.616 7f85bf4ea700  1 bluefs _allocate failed to allocate 0x4200000 on bdev 1, free 0x2d00000; fallback to bdev 2
2019-03-25 14:46:14.272 7f85bf4ea700  1 bluefs _allocate failed to allocate 0x4200000 on bdev 1, free 0x2d00000; fallback to bdev 2
2019-03-25 14:46:15.032 7f85bf4ea700  1 bluefs _allocate failed to allocate 0x4200000 on bdev 1, free 0x2d00000; fallback to bdev 2
2019-03-25 14:46:15.976 7f85bf4ea700  1 bluefs _allocate failed to allocate 0x4200000 on bdev 1, free 0x2d00000; fallback to bdev 2
2019-03-25 14:46:16.888 7f85bf4ea700  1 bluefs _allocate failed to allocate 0x4200000 on bdev 1, free 0x2d00000; fallback to bdev 2
2019-03-25 14:46:17.820 7f85bf4ea700  1 bluefs _allocate failed to allocate 0x4200000 on bdev 1, free 0x2d00000; fallback to bdev 2
2019-03-25 14:46:18.756 7f85bf4ea700  1 bluefs _allocate failed to allocate 0x4200000 on bdev 1, free 0x2d00000; fallback to bdev 2
2019-03-25 14:46:19.668 7f85bf4ea700  1 bluefs _allocate failed to allocate 0x4200000 on bdev 1, free 0x2d00000; fallback to bdev 2
2019-03-25 14:46:20.452 7f85bf4ea700  1 bluefs _allocate failed to allocate 0x4200000 on bdev 1, free 0x2d00000; fallback to bdev 2
2019-03-25 14:46:21.352 7f85bf4ea700  1 bluefs _allocate failed to allocate 0x4200000 on bdev 1, free 0x2d00000; fallback to bdev 2
2019-03-25 14:46:22.240 7f85bf4ea700  1 bluefs _allocate failed to allocate 0x4200000 on bdev 1, free 0x2d00000; fallback to bdev 2
2019-03-25 14:46:23.160 7f85bf4ea700  1 bluefs _allocate failed to allocate 0x4200000 on bdev 1, free 0x2d00000; fallback to bdev 2
2019-03-25 14:46:24.000 7f85bf4ea700  1 bluefs _allocate failed to allocate 0x4200000 on bdev 1, free 0x2d00000; fallback to bdev 2
2019-03-25 14:46:24.884 7f85bf4ea700  1 bluefs _allocate failed to allocate 0x4200000 on bdev 1, free 0x2d00000; fallback to bdev 2
2019-03-25 14:46:25.780 7f85bf4ea700  1 bluefs _allocate failed to allocate 0x4200000 on bdev 1, free 0x2d00000; fallback to bdev 2
2019-03-25 14:46:26.688 7f85bf4ea700  1 bluefs _allocate failed to allocate 0x4200000 on bdev 1, free 0x2d00000; fallback to bdev 2
2019-03-25 14:46:28.356 7f85bf4ea700  1 bluefs _allocate failed to allocate 0x4200000 on bdev 1, free 0xa00000; fallback to bdev 2
2019-03-25 14:48:22.707 7f85d12e6080  1 bluestore(/var/lib/ceph/osd/ceph-50) umount
after,
osd.50 spilled over 198 MiB metadata from 'db' device (17 GiB used of 31 GiB) to slow device
so... that is kind of weird.
rerunning with bluefs and bluestore debug enabled.
Updated by Igor Fedotov about 5 years ago
@Sage Weil, I observed up to 2x space utilization increase during compaction. You can inspect l_bluefs_max_bytes_wal, l_bluefs_max_bytes_db, l_bluefs_max_bytes_slow perf counter to confirm that. Looks like the case here as well. Log output shows that BlueFS is unable to allocate ~69 MB (which seems to be close to average SST size in RocksDB) at fast device since it has just 47MB. Hence the fallback.
So perhaps the root cause for spillover might be both level layout (as per my previous comment) and lack of space during compaction.
Updated by Sage Weil about 5 years ago
ceph-post-file: a6ef2d24-56c0-486d-bb1e-f82080c0da9e
Updated by Igor Fedotov about 5 years ago
Curious thing is that one is unable to realize what space is occupied at slow device due to fallbacks from neither "kvstore-tool stats" nor "bluestore-tool export" commands. bluestore-tool show-bdev-sizes is the only (implicit) mean.
E.g.
"kvstore-tool stats" output:
"": " L0 3/0 667.25 MB 2.6 0.0 0.0 0.0 0.0 0.0 0.0 0.0 0.0 0.0 0 0 0.000 0 0",
"": " L1 5/0 246.06 MB 1.0 0.0 0.0 0.0 0.0 0.0 0.0 0.0 0.0 0.0 0 0 0.000 0 0",
"": " L2 39/0 2.45 GB 1.0 0.0 0.0 0.0 0.0 0.0 0.0 0.0 0.0 0.0 0 0 0.000 0 0",
"": " L3 11/0 707.18 MB 0.0 0.0 0.0 0.0 0.0 0.0 0.0 0.0 0.0 0.0 0 0 0.000 0 0",
"": " Sum 58/0 4.03 GB 0.0 0.0 0.0 0.0 0.0 0.0 0.0 0.0 0.0 0.0 0 0 0.000 0 0",
"bluestore-tool show-bdev-sizes" output:
1 : device size 0x100000000 : own 0x[2000~ffffe000] = 0xffffe000 : using 0xc12fe000(3.0 GiB)
2 : device size 0x100000000 : own 0x[1ee00000~3c300000,60000000~40000000] = 0x7c300000 : using 0x44500000(1.1 Gi
Please note that used space at slow device is higher than space required by L3. Which is IMO caused by the fallback.
Updated by Konstantin Shalygin about 5 years ago
- File Selection-001.png Selection-001.png added
@Sage Weil, I observed up to 2x space utilization increase during compaction.
This is normal behavior for first compaction.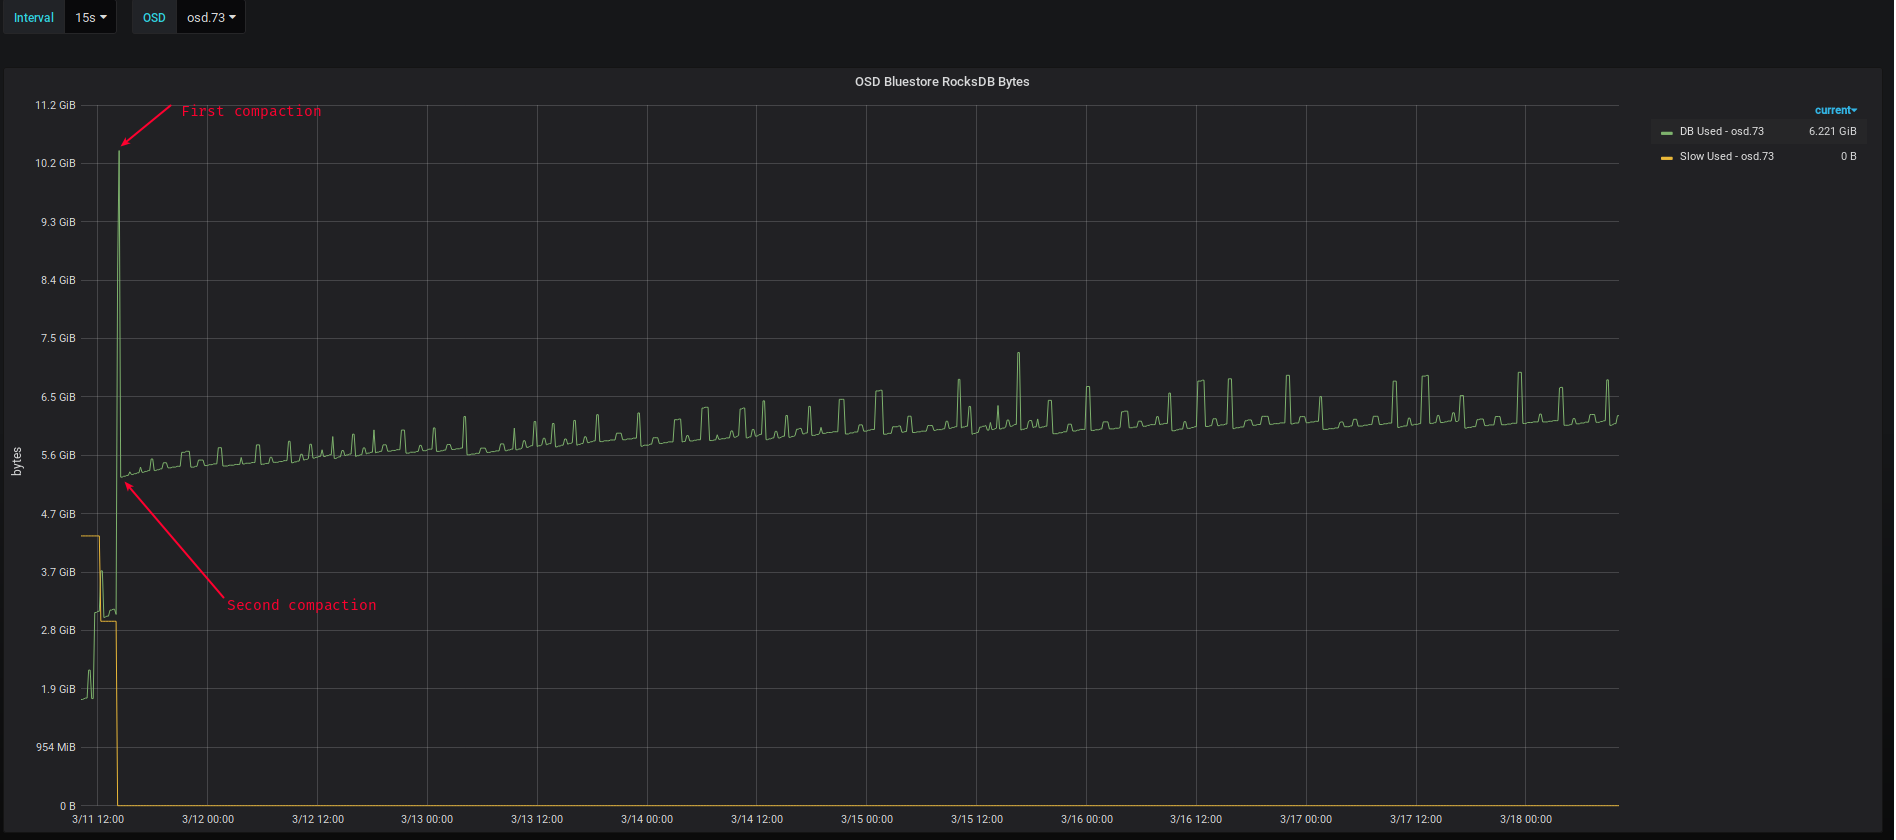
Updated by Rafal Wadolowski about 5 years ago
The slow bytes used is the problem we've been seeing for one year.
One of server has 20GB db.wal for 8TB RAW device. There is one main pool build on EC 4+2. This cluster is only object storage cluster and the slows are hitting performance on listing buckets.
Statistics for usage:
OSD.384 DB used: 8.28 GiB SLOW used= 4.51 GiB WAL used= 252.00 MiB
OSD.404 DB used: 17.57 GiB SLOW used= 77.00 MiB WAL used= 252.00 MiB
OSD.374 DB used: 8.81 GiB SLOW used= 4.87 GiB WAL used= 252.00 MiB
OSD.385 DB used: 15.46 GiB SLOW used= 0 Bytes WAL used= 252.00 MiB
OSD.382 DB used: 9.11 GiB SLOW used= 5.05 GiB WAL used= 267.00 MiB
OSD.386 DB used: 14.94 GiB SLOW used= 1.83 GiB WAL used= 252.00 MiB
OSD.401 DB used: 15.12 GiB SLOW used= 4.20 GiB WAL used= 252.00 MiB
OSD.396 DB used: 15.37 GiB SLOW used= 89.00 MiB WAL used= 252.00 MiB
OSD.377 DB used: 16.55 GiB SLOW used= 202.00 MiB WAL used= 371.00 MiB
OSD.392 DB used: 10.44 GiB SLOW used= 4.29 GiB WAL used= 304.00 MiB
OSD.403 DB used: 15.93 GiB SLOW used= 76.00 MiB WAL used= 252.00 MiB
OSD.395 DB used: 15.33 GiB SLOW used= 0 Bytes WAL used= 264.00 MiB
OSD.375 DB used: 16.16 GiB SLOW used= 4.71 GiB WAL used= 252.00 MiB
OSD.379 DB used: 6.78 GiB SLOW used= 1.75 GiB WAL used= 540.00 MiB
OSD.407 DB used: 16.47 GiB SLOW used= 141.00 MiB WAL used= 252.00 MiB
OSD.393 DB used: 15.59 GiB SLOW used= 4.19 GiB WAL used= 264.00 MiB
OSD.399 DB used: 15.28 GiB SLOW used= 4.14 GiB WAL used= 252.00 MiB
OSD.381 DB used: 15.47 GiB SLOW used= 225.00 MiB WAL used= 580.00 MiB
OSD.405 DB used: 17.07 GiB SLOW used= 6.09 GiB WAL used= 858.00 MiB
OSD.398 DB used: 14.86 GiB SLOW used= 166.00 MiB WAL used= 252.00 MiB
OSD.383 DB used: 15.12 GiB SLOW used= 78.00 MiB WAL used= 253.00 MiB
OSD.402 DB used: 18.08 GiB SLOW used= 6.04 GiB WAL used= 280.00 MiB
OSD.391 DB used: 15.78 GiB SLOW used= 3.49 GiB WAL used= 256.00 MiB
OSD.389 DB used: 9.13 GiB SLOW used= 4.58 GiB WAL used= 256.00 MiB
OSD.376 DB used: 16.92 GiB SLOW used= 1.33 GiB WAL used= 2.62 GiB
OSD.388 DB used: 15.47 GiB SLOW used= 141.00 MiB WAL used= 248.00 MiB
OSD.394 DB used: 7.74 GiB SLOW used= 4.45 GiB WAL used= 272.00 MiB
OSD.380 DB used: 15.82 GiB SLOW used= 79.00 MiB WAL used= 252.00 MiB
OSD.390 DB used: 10.88 GiB SLOW used= 5.50 GiB WAL used= 256.00 MiB
OSD.397 DB used: 8.31 GiB SLOW used= 3.73 GiB WAL used= 442.00 MiB
OSD.406 DB used: 16.69 GiB SLOW used= 195.00 MiB WAL used= 311.00 MiB
OSD.400 DB used: 16.05 GiB SLOW used= 145.00 MiB WAL used= 256.00 MiB
OSD.378 DB used: 15.22 GiB SLOW used= 152.00 MiB WAL used= 445.00 MiB
OSD.387 DB used: 13.03 GiB SLOW used= 0 Bytes WAL used= 262.00 MiB
SUM DB used: 475.00 GiB SUM SLOW used= 76.55 GiB SUM WAL used= 12.64 GiB
IMHO The compaction is only short-term resolution. I think the real problem is in how the rocksdb store data on disk. For example if you delete some of the data, they are deleted from DB, but DB still used this same space and the compaction (when it was triggered) will free it. Maybe there is a method, which is trying to optimize used space periodicaly.
Actually compaction is started by the user or by rocksdb when level ratio is above 1.0.
Updated by Konstantin Shalygin about 5 years ago
Rafal, there is not your case! You spillover is because your db is lower than 30Gb. Please consult with http://lists.ceph.com/pipermail/ceph-users-ceph.com/2019-February/033286.html
Updated by Rafal Wadolowski about 5 years ago
Konstantin Shalygin wrote:
Rafal, there is not your case! You spillover is because your db is lower than 30Gb. Please consult with http://lists.ceph.com/pipermail/ceph-users-ceph.com/2019-February/033286.html
This problem is related. The data should be only on DB, if there is free space. There is interesting split:
osd-379
{
    "rocksdb_compaction_statistics": "",
    "": "",
    "": "** Compaction Stats [default] **",
    "": "Level    Files   Size     Score Read(GB)  Rn(GB) Rnp1(GB) Write(GB) Wnew(GB) Moved(GB) W-Amp Rd(MB/s) Wr(MB/s) Comp(sec) Comp(cnt) Avg(sec) KeyIn KeyDrop",
    "": "----------------------------------------------------------------------------------------------------------------------------------------------------------",
    "": "  L0      2/0   56.73 MB   0.2      0.0     0.0      0.0       0.1      0.1       0.0   1.0      0.0     73.4         1         2    0.386       0      0",
    "": "  L3    135/0    8.47 GB   0.1      0.0     0.0      0.0       0.0      0.0       0.0   0.0      0.0      0.0         0         0    0.000       0      0",
    "": " Sum    137/0    8.53 GB   0.0      0.0     0.0      0.0       0.1      0.1       0.0   1.0      0.0     73.4         1         2    0.386       0      0",
    "": " Int      0/0    0.00 KB   0.0      0.0     0.0      0.0       0.1      0.1       0.0   1.0      0.0     73.4         1         2    0.386       0      0",
    "": "Uptime(secs): 136650.4 total, 136650.4 interval",
    "": "Flush(GB): cumulative 0.055, interval 0.055",
    "": "AddFile(GB): cumulative 0.000, interval 0.000",
    "": "AddFile(Total Files): cumulative 0, interval 0",
    "": "AddFile(L0 Files): cumulative 0, interval 0",
    "": "AddFile(Keys): cumulative 0, interval 0",
    "": "Cumulative compaction: 0.06 GB write, 0.00 MB/s write, 0.00 GB read, 0.00 MB/s read, 0.8 seconds",
    "": "Interval compaction: 0.06 GB write, 0.00 MB/s write, 0.00 GB read, 0.00 MB/s read, 0.8 seconds",
    "": "Stalls(count): 0 level0_slowdown, 0 level0_slowdown_with_compaction, 0 level0_numfiles, 0 level0_numfiles_with_compaction, 0 stop for pending_compaction_bytes, 0 slowdown for pending_compaction_bytes, 0 memtable_compaction, 0 memtable_slowdown, interval 0 total count",
    "": "",
    "": "** File Read Latency Histogram By Level [default] **",
    "": "",
    "": "** DB Stats **",
    "": "Uptime(secs): 136650.4 total, 136650.4 interval",
    "": "Cumulative writes: 259K writes, 794K keys, 259K commit groups, 1.0 writes per commit group, ingest: 0.39 GB, 0.00 MB/s",
    "": "Cumulative WAL: 259K writes, 129K syncs, 2.00 writes per sync, written: 0.39 GB, 0.00 MB/s",
    "": "Cumulative stall: 00:00:0.000 H:M:S, 0.0 percent",
    "": "Interval writes: 259K writes, 794K keys, 259K commit groups, 1.0 writes per commit group, ingest: 395.78 MB, 0.00 MB/s",
    "": "Interval WAL: 259K writes, 129K syncs, 2.00 writes per sync, written: 0.39 MB, 0.00 MB/s",
    "": "Interval stall: 00:00:0.000 H:M:S, 0.0 percent"
}
"You spillover is because your db is lower than 30Gb", why 30Gb are problem in my case?
According to your screen, we noticed this is normal effect and twice compacting cluster are clearing slow.
Updated by Konstantin Shalygin about 5 years ago
why 30Gb are problem in my case?
Because of compaction levels: https://github.com/facebook/rocksdb/wiki/Leveled-Compaction
Updated by Rafal Wadolowski about 5 years ago
Konstanin, okey but in documentation are default settings.
We have
bluestore_rocksdb_options = "compression=kSnappyCompression,max_write_buffer_number=16,min_write_buffer_number_to_merge=3,recycle_log_file_num=16,compaction_style=kCompactionStyleLevel,write_buffer_size=67108864,target_file_size_base=67108864,max_background_compactions=31,level0_file_num_compaction_trigger=8,level0_slowdown_writes_trigger=32,level0_stop_writes_trigger=64,num_levels=5,max_bytes_for_level_base=1610612736,max_bytes_for_level_multiplier=10,compaction_threads=32,flusher_threads=8"
so L0 is 1.5GB,L1 1.5GB, L2 15GB
L0+L1+L2 18GB
In https://github.com/ceph/ceph/pull/22025 I proposed option to rocksdb, that will help osd.379, but I'm not sure if that change will cover all spillover cases.
Updated by Konstantin Shalygin about 5 years ago
256MB+2.56GB+25.6GB=~28-29GB - for default Luminous options.
Updated by Xiaoxi Chen almost 5 years ago
BLUEFS_SPILLOVER BlueFS spillover detected on 7 OSD
osd.248 spilled over 257 MiB metadata from 'db' device (3.2 GiB used of 20 GiB) to slow device
osd.266 spilled over 264 MiB metadata from 'db' device (3.4 GiB used of 20 GiB) to slow device
osd.283 spilled over 330 MiB metadata from 'db' device (3.3 GiB used of 20 GiB) to slow device
osd.294 spilled over 594 MiB metadata from 'db' device (3.3 GiB used of 20 GiB) to slow device
osd.320 spilled over 279 MiB metadata from 'db' device (3.3 GiB used of 20 GiB) to slow device
osd.371 spilled over 264 MiB metadata from 'db' device (3.4 GiB used of 20 GiB) to slow device
osd.391 spilled over 264 MiB metadata from 'db' device (3.3 GiB used of 20 GiB) to slow device
one more instance, even more wired... have no idea how come I only use 3.3GB but already split over
Updated by Josh Durgin almost 5 years ago
- Assignee set to Adam Kupczyk
Adam's looking at similar spillover issues
Updated by Brett Chancellor almost 5 years ago
This is also showing up in 14.2.1 in instances where the db is overly provisioned.
HEALTH_WARN BlueFS spillover detected on 3 OSD
BLUEFS_SPILLOVER BlueFS spillover detected on 3 OSD
osd.52 spilled over 804 MiB metadata from 'db' device (29 GiB used of 148 GiB) to slow device
osd.221 spilled over 3.9 GiB metadata from 'db' device (29 GiB used of 148 GiB) to slow device
osd.245 spilled over 1.7 GiB metadata from 'db' device (28 GiB used of 148 GiB) to slow device
Updated by Dan van der Ster over 4 years ago
Us to, on hdd-only OSDs (no dedicated block.db or wal):
BLUEFS_SPILLOVER BlueFS spillover detected on 94 OSD
osd.98 spilled over 1.1 GiB metadata from 'db' device (147 MiB used of 26 GiB) to slow device
osd.135 spilled over 1.3 GiB metadata from 'db' device (183 MiB used of 26 GiB) to slow device
...
Updated by Igor Fedotov over 4 years ago
@Dan - this sounds weird - spillover without dedicated db... Could you please share 'ceph osd metadata output'?
Updated by Rafal Wadolowski over 4 years ago
@Adam DC949 are there any news about this problem? We have about ~1500 osds with spillover.
If you need some more data, feel free to contact me :)
@Dan do you have default configuration for rocksdb?
Updated by Dan van der Ster over 4 years ago
@Igor Gajowiak, @Rafal: please ignore. I was confused about the configuration of this cluster. It indeed has 26GB rocksdb's, so the spillover makes perfect sense.
Updated by Marcin W over 4 years ago
Due to spillover, I'm trying to optimize RocksDB options based on data partition size(roughly 9TB in example below). This will help to estimate how much space is needed for new DB partition on NVME and adjust parameters accordingly.
Would this calculation make sense and would it prevent spillover?
    def calculate_rocksdb_levels(self, base, multiplier, levels):
        # default Ceph setting:
        # base=256, multiplier=10, levels=5

        level_sizes = [ 0, base ]

        for level in range(2, levels+1):
            # L(n+1) = (Ln) * max_bytes_for_level_multiplier
            level_prev      = level - 1
            level_size_prev = level_sizes[level_prev]
            level_size      = level_size_prev * multiplier
            level_sizes.append(level_size)
        level_sizes_all = int((base * (1 - (multiplier**levels))) / (1-multiplier))
        # log.debug('level_sizes_all=%s, level_sizes=%s', level_sizes_all, level_sizes)
        return level_sizes_all, level_sizes

    def calculate_rocksdb_new_size(self, partition_db_size):
        # Add 10% of extra space for compaction and others. Enough?
        partition_db_size_w_spare = int(partition_db_size - (partition_db_size / 10))
        nearest_size        = 0
        nearest_settings    = {}

        # Only subset of base, multiplier and levels is taken into consideration here
        # Brute force geometric progression calculations to find
        # total space of all DB levels to be as close to partition_db_size_w_spare as possible
        for base in [ 64, 96, 128, 192, 256 ]:
            for multiplier in range(3, 10+1):
                for levels in range(4, 6+1):
                    # log.debug('base=%s, multiplier=%s, levels=%s', base, multiplier, levels)
                    level_sizes_all, level_sizes = self.calculate_rocksdb_levels(base, multiplier, levels)
                    if level_sizes_all < partition_db_size_w_spare:
                        if level_sizes_all > nearest_size:
                            nearest_size        = level_sizes_all
                            nearest_settings    = {
                                'base':         base,
                                'multiplier':   multiplier,
                                'levels':       levels,
                                'level_sizes':  level_sizes[1:],
                            }

        nearest_db_size = int(nearest_size + (nearest_size / 10))
        base            = nearest_settings['base']
        multiplier      = nearest_settings['multiplier']
        levels          = nearest_settings['levels']
        mem_buffers     = int(base/16)      # base / write_buffer_size

        db_settings = {
            'compaction_readahead_size':            '2MB',
            'compaction_style':                     'kCompactionStyleLevel',
            'compaction_threads':                   '%s' % (mem_buffers * 2),
            'compression':                          'kNoCompression',
            'flusher_threads':                      '8',
            'level0_file_num_compaction_trigger':   '%s' % int(mem_buffers / 2),
            'level0_slowdown_writes_trigger':       '%s' % (mem_buffers + 8),
            'level0_stop_writes_trigger':           '%s' % (mem_buffers + 16),
            'max_background_compactions':           '%s' % (mem_buffers * 2),
            'max_bytes_for_level_base':             '%sMB' % base,
            'max_bytes_for_level_multiplier':       '%s' % multiplier,
            'max_write_buffer_number':              '%s' % mem_buffers,
            'min_write_buffer_number_to_merge':     '%s' % int(mem_buffers / 2),
            'num_levels':                           '%s' % levels,
            'recycle_log_file_num':                 '2',
            'target_file_size_base':                '16MB',
            'write_buffer_size':                    '16MB',
        }

        db_settings_join = ','.join([ '%s=%s' % (k, db_settings[k]) for k in sorted(db_settings.keys()) ])
        log.debug('partition_db_size=%s, partition_db_size_w_spare=%s, nearest_db_size=%s, %s', partition_db_size, partition_db_size_w_spare, nearest_db_size, db_settings_join)
        log.debug('final partition_db_size=%s, levels=%s, levels_total=%s', nearest_db_size, nearest_settings['level_sizes'], nearest_size)
        return nearest_db_size, db_settings_join

    def calc_db_size_for_block(self, data_size):
        # Assume DB size is about 5% of data partition
        db_size         = int(int(int((data_size * 5 / 100) + 1) / 2) * 2)
        log.debug('data_size=%s, db_size_free=%s', data_size, db_size)

        return self.calculate_rocksdb_new_size(db_size)
/dev/sdc: for data, partition size: 9537532 MB, 5% = partition_db_size(476876 MB)
nearest_db_size=437888 MB, compaction_readahead_size=2MB,compaction_style=kCompactionStyleLevel,compaction_threads=32,compression=kNoCompression,flusher_threads=8,level0_file_num_compaction_trigger=8,level0_slowdown_writes_trigger=24,level0_stop_writes_trigger=32,max_background_compactions=32,max_bytes_for_level_base=256MB,max_bytes_for_level_multiplier=6,max_write_buffer_number=16,min_write_buffer_number_to_merge=8,num_levels=5,recycle_log_file_num=2,target_file_size_base=16MB,write_buffer_size=16MB'
final partition_db_size=437888, levels=[256, 1536, 9216, 55296, 331776], levels_total=398080'
At this point, LVM will create 437888MB db_lv and ceph.conf needs extra section:
[osd.X]
bluestore_rocksdb_options = {{ db_settings_join }}
Updated by Yoann Moulin about 4 years ago
Hello,
I also have this message on a Nautilus cluster, should I must worry about ?
artemis@icitsrv5:~$ ceph --version
ceph version 14.2.8 (2d095e947a02261ce61424021bb43bd3022d35cb) nautilus (stable)
artemis@icitsrv5:~$ ceph -s
  cluster:
    id:     815ea021-7839-4a63-9dc1-14f8c5feecc6
    health: HEALTH_WARN
            BlueFS spillover detected on 1 OSD(s)

  services:
    mon: 3 daemons, quorum iccluster003,iccluster005,iccluster007 (age 7w)
    mgr: iccluster021(active, since 10h), standbys: iccluster009, iccluster023
    mds: cephfs:5 5 up:active
    osd: 120 osds: 120 up (since 22h), 120 in (since 45h)
    rgw: 8 daemons active (iccluster003.rgw0, iccluster005.rgw0, iccluster007.rgw0, iccluster013.rgw0, iccluster015.rgw0, iccluster019.rgw0, iccluster021.rgw0, iccluster023.rgw0)

  data:
    pools:   10 pools, 2161 pgs
    objects: 204.46M objects, 234 TiB
    usage:   367 TiB used, 295 TiB / 662 TiB avail
    pgs:     2157 active+clean
             3    active+clean+scrubbing+deep
             1    active+clean+scrubbing

  io:
    client:   504 B/s rd, 270 KiB/s wr, 0 op/s rd, 9 op/s wr
artemis@icitsrv5:~$ ceph health detail
HEALTH_WARN BlueFS spillover detected on 1 OSD(s)
BLUEFS_SPILLOVER BlueFS spillover detected on 1 OSD(s)
     osd.1 spilled over 324 MiB metadata from 'db' device (28 GiB used of 64 GiB) to slow device
Thanks,
Best regards,
Yoann
Updated by Eneko Lacunza about 4 years ago
- File ceph-osd.5.log ceph-osd.5.log added
Hi, we're seeing this issue too. Using 14.2.8 (proxmox build)
We originally had 1GB rocks.db partition:
- ceph health detail
HEALTH_WARN BlueFS spillover detected on 3 OSD
BLUEFS_SPILLOVER BlueFS spillover detected on 3 OSD
osd.3 spilled over 78 MiB metadata from 'db' device (1024 MiB used of 1024 MiB) to slow device
osd.4 spilled over 78 MiB metadata from 'db' device (1024 MiB used of 1024 MiB) to slow device
osd.5 spilled over 84 MiB metadata from 'db' device (1024 MiB used of 1024 MiB) to slow device
We have created new 6GiB partitions for rocks.db, copied the original partition, then extended it with "ceph-bluestore-tool bluefs-bdev-expand". Now we get:
- ceph health detail
HEALTH_WARN BlueFS spillover detected on 3 OSD
BLUEFS_SPILLOVER BlueFS spillover detected on 3 OSD
osd.3 spilled over 5 MiB metadata from 'db' device (555 MiB used of 6.0 GiB) to slow device
osd.4 spilled over 5 MiB metadata from 'db' device (552 MiB used of 6.0 GiB) to slow device
osd.5 spilled over 5 MiB metadata from 'db' device (561 MiB used of 6.0 GiB) to slow device
Issuing "ceph daemon osd.X compact" doesn't help, but shows the following transitional state:
- ceph daemon osd.5 compact
{
"elapsed_time": 5.4560688339999999
} - ceph health detail
HEALTH_WARN BlueFS spillover detected on 3 OSD
BLUEFS_SPILLOVER BlueFS spillover detected on 3 OSD
osd.3 spilled over 5 MiB metadata from 'db' device (556 MiB used of 6.0 GiB) to slow device
osd.4 spilled over 5 MiB metadata from 'db' device (552 MiB used of 6.0 GiB) to slow device
osd.5 spilled over 5 MiB metadata from 'db' device (1.1 GiB used of 6.0 GiB) to slow device
(...and after a while...) - ceph health detail
HEALTH_WARN BlueFS spillover detected on 3 OSD
BLUEFS_SPILLOVER BlueFS spillover detected on 3 OSD
osd.3 spilled over 5 MiB metadata from 'db' device (556 MiB used of 6.0 GiB) to slow device
osd.4 spilled over 5 MiB metadata from 'db' device (552 MiB used of 6.0 GiB) to slow device
osd.5 spilled over 5 MiB metadata from 'db' device (551 MiB used of 6.0 GiB) to slow device
Please find attached manual compaction log.
Updated by Igor Fedotov about 4 years ago
Eneko,
could you please attach output for 'ceph-kvstore-tool bluestore-kv <path-to-osd> stats' command?
I suppose this is an expected behavior and can be simply ignored (and warning suppressed if needed). Given minor amount of spilled over data I expect no visible performance impact.
Once this backport PR (https://github.com/ceph/ceph/pull/33889) is merged one will have some tuning means to avoid/smooth the case.
Also generally I would recommend to have 64G DB/WAL volume for low-/mid-size deployments.
Updated by Marcin W about 4 years ago
I've read somewhere in docs that recommended DB size is no less that 5% of block. IMO if we consider either 64GB or 5% of block size, it is still likely to spill or underutilise because default RocksDB settings are static ergo levels and their sizes are constant. IIRC, the default level multiplier is 10(recommended by FB) so, levels will grow quickly. If the block device size is small, it will spill eventually. If block size is enormous, DB may be underprovisioned. According to my experience, pre-calculating RocksDB parameters makes sense because it takes into consideration block sizes independently. For this purpose, I'm using the code I posted above with small modifications. Currently, its limitation is that entire RocksDB has to fit into dedicated LV - it doesn't allow to spill and will fall on face if DB content grows too much. I'd advise to include additional level on top of what this code produces to make sure there is enough room to spill if entire DB space is allocated. I know that calculating settings may be cumbersome and error prone but IMO one size doesn't fit all.
Updated by Marcin W about 4 years ago
BTW. These are the default RocksDB params IIRC (in GB):
base=256, multiplier=10, levels=5
0= 0.25
1= 0,25
2= 2,5
3= 25
4= 250
5= 2500
So, If LV size of DB is 64GB, levels 1-3 will fit like a glove but level 4 guaranties spillage due to RocksDB nature - the code makes sure there is enough space to fit all files for new level before creating first file.
Updated by Eneko Lacunza about 4 years ago
Thanks @Igor Gajowiak
Sorry for the delay getting back, I didn't receive any email regarding your update from tracker.
I've just attached stats info for osd.5 . We have currently suppressed spillover warning for those 3 OSD, yes, but I'd like to get a warning if the current 6GB isn't enough when db increases to values near 3GB... :)
Is your 64GB recommendation the same as 60GB in other ceph-user mailing list messages? Is there a reason to be 64GB instead of 60GB? (I understand that being 60GB instead of 30GB is to have enough space for compaction...)
In this case, originally db partitions where 1 GB due proxmox default values. We may not have enough space to allocate 60GB for all OSDs, that's why I tried 6GB ;)
Thanks a lot
Updated by Igor Fedotov about 4 years ago
Eneko,
to be honest 60GB and 64GB are pretty the same to me. The estimate which resulted in this value did some rounding and assumptions like:
1) Take 30 GB to fit L1+L3 (250MB + 2.5GB + 25GB). Rounding!
2) Take 100% to fit the worst possible compaction. Assumption!
3) Take additional 4GB for WAL which in fact I've never seen above 1GB. Taking some spare just in case!
So 64GB is just a nice final value which has some spare volume included.
Updated by Igor Fedotov about 4 years ago
Marcin W wrote:
BTW. These are the default RocksDB params IIRC (in GB):
base=256, multiplier=10, levels=50= 0.25
1= 0,25
2= 2,5
3= 25
4= 250
5= 2500So, If LV size of DB is 64GB, levels 1-3 will fit like a glove but level 4 guaranties spillage due to RocksDB nature - the code makes sure there is enough space to fit all files for new level before creating first file.
Marcin, yeah,you're almost right. But we recommend 100% spare volume for interim processes like compaction. I've observed up to 100% overhead for this purposes in the lab. Certainly production might not experience such space usage peaks most of time if any. And hence one can actually apply some value in 30GB - 64GB range. Higher value will provide more reliability though. 64GB is just a recommendation to make things simple and straightforward while being the most reliable.
Updated by Igor Fedotov about 4 years ago
In short - I'm trying to pretty conservative when suggesting 64GB for DB/WAL volume.
Updated by Eneko Lacunza about 4 years ago
Thanks a lot Igor. Will wait for the backport PR and will report back the results.
Updated by Marcin W about 4 years ago
Hi Igor,
So, your recommendation is to create a volume which can serve enough space for levels 1-3, compaction and file reuse purposes only.
Does it mean that according to your tests/observations the DB is never going to grow bigger than level 3(not exceed ~30GB)?
Updated by Igor Fedotov about 4 years ago
Marcin,
30-64GB is an optimal configuration. Certainly if one can affort 250+ GB drive and hence serve L4 - it's OK too. And definitely make sense if OSD load needs it.
30GB isn't enough sometimes IMO. This is OK for static DB store. But compaction might result in some temporary/peak loads. As I mentioned I've seen once up to 100% of L3 in the lab.
The above mentioned PR introduces some statistics collection means to be better aware about this peak utilization.
Updated by Seena Fallah almost 4 years ago
I'm experiencing this in nautilus 14.2.9
Should the above PR solve this issue? I get what does the message really mean? I have 200GB db for my 10TB block and as I see in both prometheus and `ceph osd df` there is only 28GB of db is used. Can you explain more about it?
osd.35 spilled over 1.5 GiB metadata from 'db' device (28 GiB used of 191 GiB) to slow device
Updated by Marcin W almost 4 years ago
Hi Seena,
Metadata is stored in RocksDB which a 'logging database'. It doesn't replace or remove entries, it just appends changes to end of file. It's normal that it accumulates lots of changes over time and it needs to be compacted(flatten to discard obsolete objects). RocksDB is split into levels which you can see in my comment above. If it needs more space for changes, it creates new level(group of files). Every level is 10x bigger than previous one. Your total allocated DB size is 28GB and at this point it created files for level 4 which needs 250GB. The condition is that whole level has to fit on single device and your DB partition doesn't offer enough space(total 191GB). Levels 0-3 reside on DB partition but in this case, DB expanded to slow device(block device where data is stored). It can affect performance depending on class of data partition(HDD, SSD, NVME).
Running RocksDB compaction from time to time prevents that issue. I have the below bash script in cron and it runs at night. You will have to think of good time of day/week when it's OK to schedule when cluster is not busy. Perhaps running it on weekend would be safer. The script doesn't stop the cluster, it will just lock DB on each disk for couple of seconds/minutes.
Perhaps Igor can clarify if I missed sth.
#!/bin/bash

export CEPH_DEV=1

/usr/bin/ceph osd ls | xargs -rn1 -I '{}' /usr/bin/ceph tell osd.'{}' compact
/usr/bin/ceph mon compact
Updated by Igor Fedotov almost 4 years ago
@Marcin Garski - perfect overview, thanks!
Just want to mention that this "granular" level space allocation has been fixed in both Octopus and upcoming Nautilus release.
See https://github.com/ceph/ceph/pull/33889
Updated by Seena Fallah almost 4 years ago
@Marcin Garski Really thanks for your overview. Now I get's what's going on.
Updated by Seena Fallah almost 4 years ago
@Marcin Garski One more question I would be so thankful if you answer me, How did you find out that db is now on level 4? I mean what's the size limit on level one?
Updated by Seena Fallah almost 4 years ago
Igor Fedotov wrote:
@Marcin Garski - perfect overview, thanks!
Just want to mention that this "granular" level space allocation has been fixed in both Octopus and upcoming Nautilus release.
See https://github.com/ceph/ceph/pull/33889
@Igor Gajowiak Can you please explain how does this "granular" level space allocation will fix? I mean after next release of nautilus should I still compact db or it will automatically compact previous levels?
Updated by Marcin W almost 4 years ago
Hi Seena,
"How did you find out that db is now on level 4? I mean what's the size limit on level one?"
These are the sizes of each level in GB:
0= 0.25 <- in memory
1= 0,25
2= 2,5
3= 25
4= 250
5= 2500
You mentioned that allocated space is 28GB. It would include levels 1+2+3(from the list above) = 27,75GB plus some files for reuse.
Level 4 is the reported spillage.
Updated by Igor Fedotov almost 4 years ago
Seena Fallah wrote:
Igor Fedotov wrote:
@Marcin Garski - perfect overview, thanks!
Just want to mention that this "granular" level space allocation has been fixed in both Octopus and upcoming Nautilus release.
See https://github.com/ceph/ceph/pull/33889@Igor Gajowiak Can you please explain how does this "granular" level space allocation will fix? I mean after next release of nautilus should I still compact db or it will automatically compact previous levels?
@Seena - first of all compacting DB is generally not a mean to avoid spillover. It can help sometimes but generally spillovers happen when fast device lacks space to fit all the data. Compaction just helps to keep data in a more optimal way, i.e. levels tend to take less space. But at some point one can get the next data level anyway.
And as Marcin explained currently RockDB spills the every level's byte if there is no enough space at fast device to fit the level completely. E.g. with the default settings L3 needs 25GB and L4 needs 250GB. Hence L4 data are unconditionally spilled over for e.g. 100GB drive. And given that L1+L2+l3 takes max 30GB (a bit simplified measurement!) 70GB of available space are wasted permanently.
The above-mentioned patch alleviates these losses by allowing to [partially] use that "wasted" space for L4 data. I.e. from now one RocksDB is able to keep level data at fast volume even when level at its full capacity doesn't fit into fast volume.
You can find some additional info in the master PR:
https://github.com/ceph/ceph/pull/29687
Updated by Seena Fallah almost 4 years ago
Thanks @Igor Gajowiak for your help again.
I saw a new behavior now and I don't see any level gets score 1.0 but ceph says the OSD is spillover. Does it still needs compaction? If it needs why there there is no full level in compaction stats?
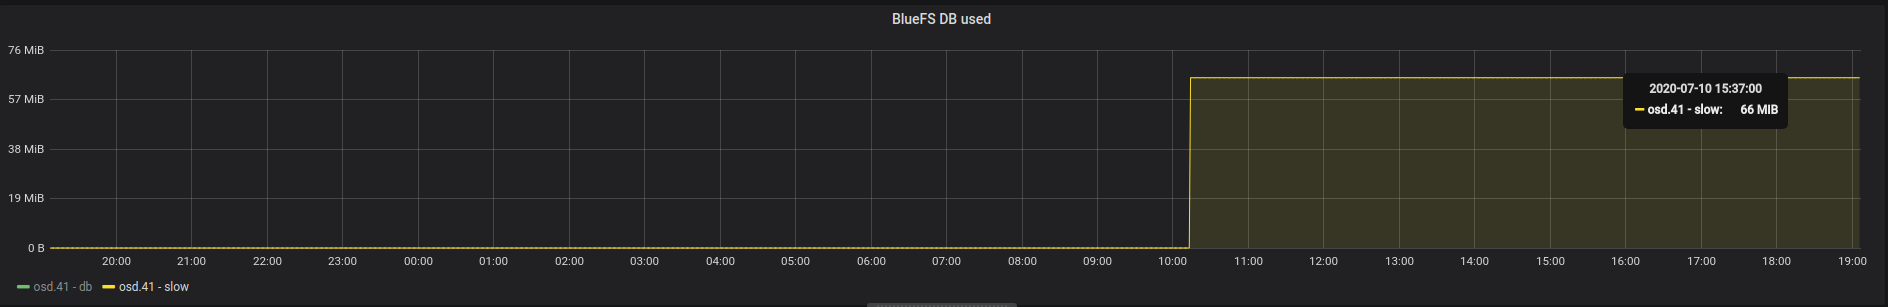
osd.41 spilled over 66 MiB metadata from 'db' device (30 GiB used of 191 GiB) to slow device
** Compaction Stats [default] **
Level    Files   Size     Score Read(GB)  Rn(GB) Rnp1(GB) Write(GB) Wnew(GB) Moved(GB) W-Amp Rd(MB/s) Wr(MB/s) Comp(sec) CompMergeCPU(sec) Comp(cnt) Avg(sec) KeyIn KeyDrop
----------------------------------------------------------------------------------------------------------------------------------------------------------------------------
  L0      0/0    0.00 KB   0.0      0.0     0.0      0.0      54.9     54.9       0.0   1.0      0.0    171.0    328.58            312.96      1281    0.257       0      0
  L1      1/0   65.41 MB   0.7    105.8    55.0     50.7      97.3     46.6       0.0   1.8    241.6    222.3    448.21            417.64       333    1.346    185M    15M
  L2      8/0   498.21 MB   0.9    220.6    45.0    175.6     213.0     37.4       1.7   4.7    237.2    229.1    952.22            872.29       780    1.221    378M  9906K
  L3     42/0    1.78 GB   0.9    180.7    38.4    142.4     164.5     22.1       1.2   4.3    229.1    208.5    807.94            714.33       616    1.312    350M    41M
  L4    429/0   27.06 GB   0.1     31.5     5.0     26.4      29.5      3.1      24.0   5.9    261.6    245.3    123.22            108.54        16    7.701     39M    18M
 Sum    480/0   29.39 GB   0.0    538.5   143.4    395.1     559.2    164.1      26.9  10.2    207.3    215.2   2660.17           2425.76      3026    0.879    954M    84M
 Int      0/0    0.00 KB   0.0      0.0     0.0      0.0       0.0      0.0       0.0   0.0      0.0      0.0      0.00              0.00         0    0.000       0      0
And one more question. My db device is 191GB and with this leveling at level 4 There should be a 250GB space but I win't have it never. Should I change the default settings to fit with my db device space? If yes can you help me with the config name? I can't find it.
Thanks.
Updated by Seena Fallah almost 4 years ago
- File Screenshot from 2020-07-10 19-07-33.png Screenshot from 2020-07-10 19-07-33.png added
- File Screenshot from 2020-07-10 19-19-33.png Screenshot from 2020-07-10 19-19-33.png added
And also here in graphs you can see the bluefs db used is decreasing after slow used increases but still slow bytes is used
Updated by Seena Fallah almost 4 years ago
I found
uint64_t target_file_size_base = 64 * 1048576;
in rocksdb Ceph repo and it seems each level is 64MB. I have also check bluestore_rocksdb_options in my OSD and there were no override configs for target_file_size_base.
Am I wrong?