Actions
Bug #47435
closednautilus: mgr/dashboard: Monitoring - All Alerts: The alerts still seem to be loading
Status:
Resolved
Priority:
Immediate
Assignee:
Category:
Monitoring
Target version:
% Done:
0%
Source:
Q/A
Tags:
Backport:
Regression:
No
Severity:
3 - minor
Reviewed:
Description
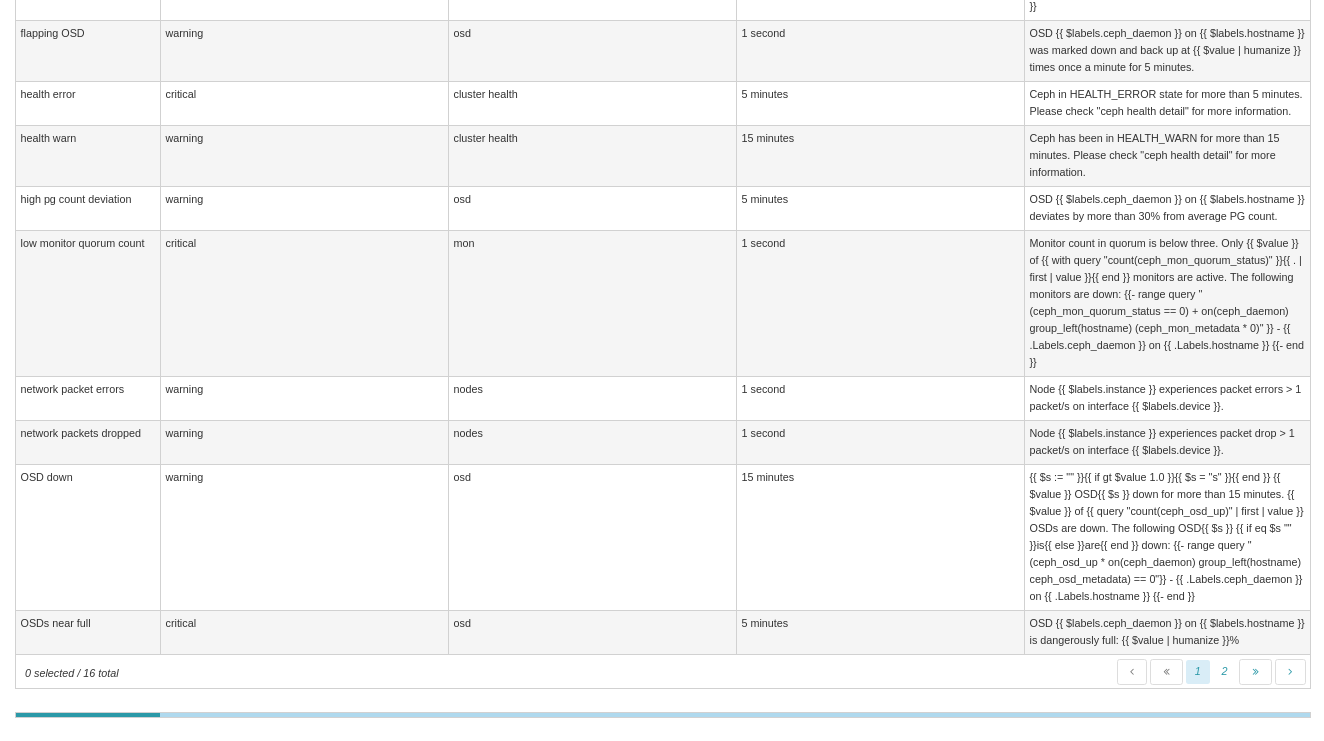
Navigate to cluster -> Monitoring -> All Alerts tab
Observe the horizontal line, seems to be still loading the data, even though the 13 alerts are already displayed.
note: This continuous loading seen in the scroll bar, stops upon selecting any alert.
Files
Updated by Nizamudeen A over 3 years ago
- Subject changed from mgr/dashboard: Monitoring - All Alerts: The alerts still seem to be loading to mgr/dashboard:nautilus: Monitoring - All Alerts: The alerts still seem to be loading
Updated by Nizamudeen A over 3 years ago
- Subject changed from mgr/dashboard:nautilus: Monitoring - All Alerts: The alerts still seem to be loading to nautilus: mgr/dashboard: Monitoring - All Alerts: The alerts still seem to be loading
Updated by Nizamudeen A over 3 years ago
- Assignee set to Nizamudeen A
- Pull request ID set to 37161
Updated by Nizamudeen A over 3 years ago
- Status changed from New to Fix Under Review
Updated by Nathan Cutler over 3 years ago
- Related to Cleanup #46249: mgr/dashboard: Remove useless tab in monitoring/alerts datatable details added
Updated by Nathan Cutler over 3 years ago
- Status changed from Fix Under Review to Resolved
Updated by Ernesto Puerta about 3 years ago
- Project changed from mgr to Dashboard
- Category changed from 148 to Monitoring
Actions