Actions
Bug #46683
closedmgr/dashboard: cpu stats incorrectly displayed
% Done:
0%
Source:
Tags:
Backport:
octopus, nautilus
Regression:
No
Severity:
3 - minor
Reviewed:
Description
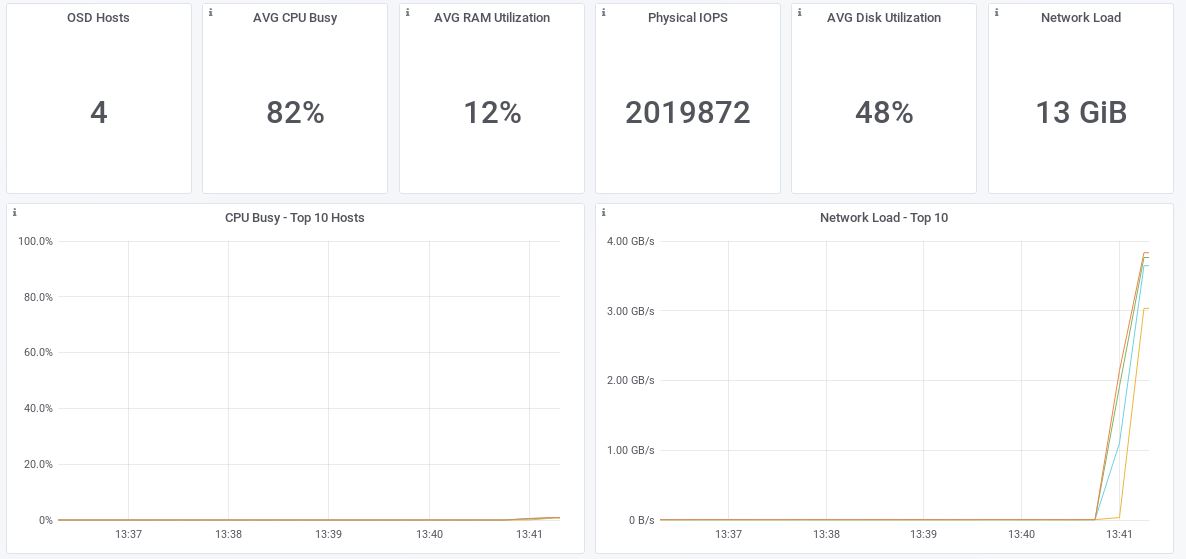
The hosts screen on the dashboard displays incorrect data on the CPU usage for the nodes in the cluster.
Actual results:
The usage is near 0% when in fact the 4 nodes are around 85% busy.
Expected results:
near real-time metrics
Files
Updated by Avan Thakkar almost 4 years ago
- Assignee set to Avan Thakkar
- Pull request ID set to 36258
Updated by Alfonso Martínez almost 4 years ago
- Status changed from New to Fix Under Review
Updated by Volker Theile almost 4 years ago
- Status changed from Fix Under Review to Pending Backport
Updated by Avan Thakkar almost 4 years ago
- Copied to Backport #46736: octopus: mgr/dashboard: cpu stats incorrectly displayed added
Updated by Lenz Grimmer almost 4 years ago
- Status changed from Pending Backport to Resolved
Updated by Avan Thakkar over 3 years ago
- Status changed from Resolved to Pending Backport
- Backport changed from octopus to octopus, nautilus
Updated by Avan Thakkar over 3 years ago
- Copied to Backport #47573: nautilus: mgr/dashboard: cpu stats incorrectly displayed added
Updated by Nathan Cutler over 3 years ago
- Status changed from Pending Backport to Resolved
While running with --resolve-parent, the script "backport-create-issue" noticed that all backports of this issue are in status "Resolved" or "Rejected".
Updated by Ernesto Puerta about 3 years ago
- Project changed from mgr to Dashboard
- Category changed from 148 to Monitoring
Actions