Bug #41234
closedMore than 100% in a dashboard PG Status
0%
Description
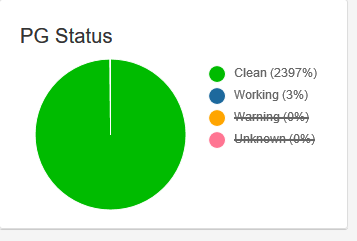
I have ceph nautilus (upgraded from mimic, if it is important) and in dashboard in "PG Status" section I see "Clean (2397%)"
Files
Updated by Alfonso Martínez over 4 years ago
Can you attach ceph mgr logs?
Any additional info that you have can help.
Updated by Fyodor Ustinov over 4 years ago
mgr look now look like
2019-08-17 19:03:59.278 7f5523a07700 0 log_channel(cluster) log [DBG] : pgmap v227835: 4608 pgs: 4 active+clean+scrubbing, 9 active+clean+scrubbing+deep+repair, 4595 active+clean; 28 TiB data, 106 TiB used, 394 TiB / 501 TiB avail; 19 KiB/s rd, 2.6 MiB/s wr, 121 op/s
2019-08-17 19:04:01.287 7f5523a07700 0 log_channel(cluster) log [DBG] : pgmap v227836: 4608 pgs: 4 active+clean+scrubbing, 9 active+clean+scrubbing+deep+repair, 4595 active+clean; 28 TiB data, 106 TiB used, 394 TiB / 501 TiB avail; 34 KiB/s rd, 2.2 MiB/s wr, 133 op/s
2019-08-17 19:04:03.295 7f5523a07700 0 log_channel(cluster) log [DBG] : pgmap v227837: 4608 pgs: 4 active+clean+scrubbing, 9 active+clean+scrubbing+deep+repair, 4595 active+clean; 28 TiB data, 106 TiB used, 394 TiB / 501 TiB avail; 42 KiB/s rd, 2.4 MiB/s wr, 141 op/s
2019-08-17 19:04:05.303 7f5523a07700 0 log_channel(cluster) log [DBG] : pgmap v227838: 4608 pgs: 4 active+clean+scrubbing, 9 active+clean+scrubbing+deep+repair, 4595 active+clean; 28 TiB data, 106 TiB used, 394 TiB / 501 TiB avail; 47 KiB/s rd, 2.5 MiB/s wr, 158 op/s
2019-08-17 19:04:07.311 7f5523a07700 0 log_channel(cluster) log [DBG] : pgmap v227839: 4608 pgs: 4 active+clean+scrubbing, 9 active+clean+scrubbing+deep+repair, 4595 active+clean; 28 TiB data, 106 TiB used, 394 TiB / 501 TiB avail; 43 KiB/s rd, 2.5 MiB/s wr, 153 op/s
2019-08-17 19:04:09.318 7f5523a07700 0 log_channel(cluster) log [DBG] : pgmap v227840: 4608 pgs: 4 active+clean+scrubbing, 9 active+clean+scrubbing+deep+repair, 4595 active+clean; 28 TiB data, 106 TiB used, 394 TiB / 501 TiB avail; 41 KiB/s rd, 2.0 MiB/s wr, 132 op/s
2019-08-17 19:04:11.327 7f5523a07700 0 log_channel(cluster) log [DBG] : pgmap v227841: 4608 pgs: 4 active+clean+scrubbing, 9 active+clean+scrubbing+deep+repair, 4595 active+clean; 28 TiB data, 106 TiB used, 394 TiB / 501 TiB avail; 46 KiB/s rd, 2.2 MiB/s wr, 147 op/s
2019-08-17 19:04:13.336 7f5523a07700 0 log_channel(cluster) log [DBG] : pgmap v227842: 4608 pgs: 4 active+clean+scrubbing, 9 active+clean+scrubbing+deep+repair, 4595 active+clean; 28 TiB data, 106 TiB used, 394 TiB / 501 TiB avail; 32 KiB/s rd, 2.2 MiB/s wr, 138 op/s
2019-08-17 19:04:15.345 7f5523a07700 0 log_channel(cluster) log [DBG] : pgmap v227843: 4608 pgs: 3 active+clean+scrubbing, 10 active+clean+scrubbing+deep+repair, 4595 active+clean; 28 TiB data, 106 TiB used, 394 TiB / 501 TiB avail; 24 KiB/s rd, 1.9 MiB/s wr, 136 op/s
2019-08-17 19:04:17.352 7f5523a07700 0 log_channel(cluster) log [DBG] : pgmap v227844: 4608 pgs: 2 active+clean+scrubbing, 11 active+clean+scrubbing+deep+repair, 4595 active+clean; 28 TiB data, 106 TiB used, 394 TiB / 501 TiB avail; 20 KiB/s rd, 1.2 MiB/s wr, 114 op/s
2019-08-17 19:04:19.360 7f5523a07700 0 log_channel(cluster) log [DBG] : pgmap v227845: 4608 pgs: 2 active+clean+scrubbing, 11 active+clean+scrubbing+deep+repair, 4595 active+clean; 28 TiB data, 106 TiB used, 394 TiB / 501 TiB avail; 20 KiB/s rd, 784 KiB/s wr, 101 op/s
2019-08-17 19:04:21.369 7f5523a07700 0 log_channel(cluster) log [DBG] : pgmap v227846: 4608 pgs: 2 active+clean+scrubbing, 11 active+clean+scrubbing+deep+repair, 4595 active+clean; 28 TiB data, 106 TiB used, 394 TiB / 501 TiB avail; 26 KiB/s rd, 790 KiB/s wr, 111 op/s
2019-08-17 19:04:23.378 7f5523a07700 0 log_channel(cluster) log [DBG] : pgmap v227847: 4608 pgs: 2 active+clean+scrubbing, 11 active+clean+scrubbing+deep+repair, 4595 active+clean; 28 TiB data, 106 TiB used, 394 TiB / 501 TiB avail; 21 KiB/s rd, 734 KiB/s wr, 107 op/s
2019-08-17 19:04:25.387 7f5523a07700 0 log_channel(cluster) log [DBG] : pgmap v227848: 4608 pgs: 2 active+clean+scrubbing, 11 active+clean+scrubbing+deep+repair, 4595 active+clean; 28 TiB data, 106 TiB used, 394 TiB / 501 TiB avail; 20 KiB/s rd, 761 KiB/s wr, 109 op/s
2019-08-17 19:04:27.394 7f5523a07700 0 log_channel(cluster) log [DBG] : pgmap v227849: 4608 pgs: 2 active+clean+scrubbing, 11 active+clean+scrubbing+deep+repair, 4595 active+clean; 28 TiB data, 106 TiB used, 394 TiB / 501 TiB avail; 18 KiB/s rd, 708 KiB/s wr, 96 op/s
Updated by Stephan Hohn over 4 years ago
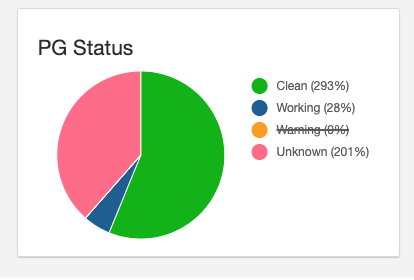
- File Screenshot 2019-09-06 at 09.14.09.png Screenshot 2019-09-06 at 09.14.09.png added
- File Screenshot 2019-09-06 at 09.14.38.png Screenshot 2019-09-06 at 09.14.38.png added
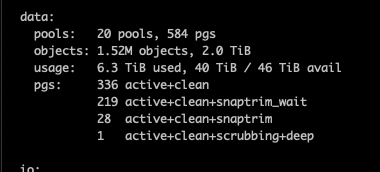
Same here during snap trim (Ceph - v14.2.2)
Updated by Lenz Grimmer over 4 years ago
- Status changed from New to Duplicate
Duplicate of #41536 (which also has a pull request pending to fix this)
Updated by Lenz Grimmer over 4 years ago
- Has duplicate Bug #41536: Total amount to PG's is more than 100% added
Updated by Ernesto Puerta about 3 years ago
- Project changed from mgr to Dashboard
- Category changed from 132 to General