Actions
Bug #58842
openmgr/dashboard: Pools stats showing NAN
% Done:
0%
Source:
Tags:
Backport:
Regression:
No
Severity:
3 - minor
Reviewed:
Affected Versions:
ceph-qa-suite:
Pull request ID:
Crash signature (v1):
Crash signature (v2):
Description
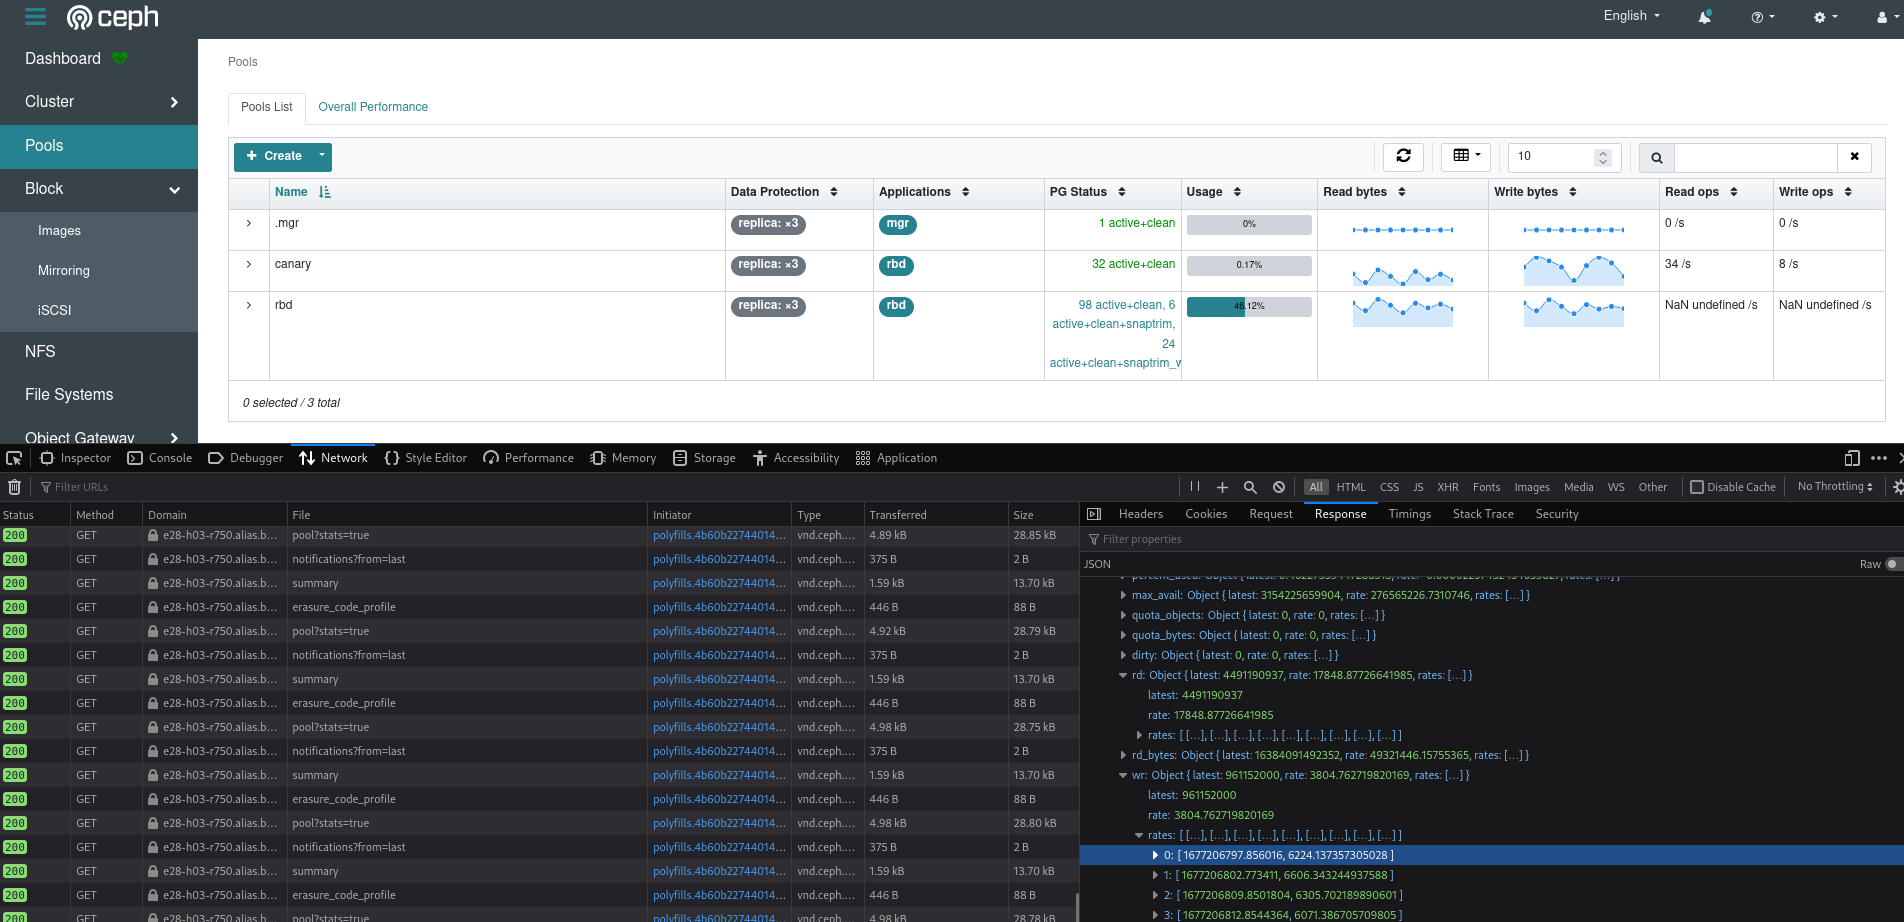
Pools stats showing NAN
Pool performance on busy pools showing NAN undefined (screenshot provided)
This is similar to the triaged bug https://tracker.ceph.com/issues/53591
I've also attached the json payload from the pool?stats=true call
Environment
ceph versionstring:- Platform (OS/distro/release):
- Cluster details (nodes, monitors, OSDs):
- Did it happen on a stable environment or after a migration/upgrade?:
- Browser used (e.g.:
Version 86.0.4240.198 (Official Build) (64-bit)):
How reproducible
Steps:
- Run a cluster under load (in my case rbd, 12,500 IOPS).
Actual results
See screenshot and json provided
Expected results
UI should show the same information that is available at the CLI
  io:
    client:   44 MiB/s rd, 13 MiB/s wr, 13.62k op/s rd, 3.07k op/s wr
Additional info
here
Files
No data to display
Actions