Bug #58106
openwhen a large number of error ops appear in the OSDs,pglog does not trim.
0%
Description
When We use the s3 interface append and copy of the object gateway, a large number of error ops appear in the OSDs when the pressure is high and concurrent. We have an S3 cluster with OSDs running out of memory due to the large amount of ram needed to hold pglog entries.This causes the OSDs memory oom. Because a large number of error pglogs are not written to the hard disk. This causes the pglog trim mechanism to fail. pglog does not trim error op. How to solve this problem?
(This is on an osd with osd_memory_target = 2GB, and the osd has 223 PGs).
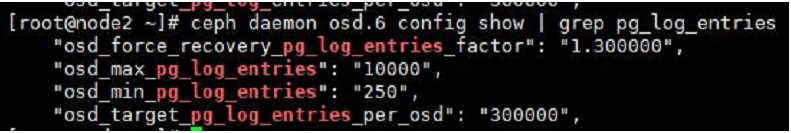
osd_max_pg_log_entries=10000
osd_min_pg_log_entries: 250
osd_pg_log_trim_max: 10000,
osd_pg_log_trim_min: 100,
osd_target_pg_log_entries_per_osd: 300000,
Files
Updated by Nitzan Mordechai over 1 year ago
@王子敬 wang can you please provide the output of 'ceph pg dump' ?
Updated by 王子敬 wang over 1 year ago
- File pg_dump.txt pg_dump.txt added
Nitzan Mordechai wrote:
@王子敬 wang can you please provide the output of 'ceph pg dump' ?
ok, the output in the pg_dump.txt.The whole output file is too large. I have intercepted part of it.
There are some other phenomena
I saw a lot of error op in pg_log
{ "op": "error",
"object": "",
..........
}
ceph daemon osd.0 dump_mempools
"osd_pglog"{
"item": 645472,
"bytes": 2083163019
},
Updated by Nitzan Mordechai over 1 year ago
@王子敬 wang, can you please send us the output for one of the pgs from ceph-objectstore-tool?
ceph-objectstore-tool --data-path /var/lib/ceph/osd/ceph-9 --op log --pgid 3.0 --no-mon-config'
we need to count find out if the issue here is really error entries or dups
you can check that against the output json with
| jq '(.pg_log_t.log|length),(.pg_log_t.dups|length)
i ran a quick check, it looks like we are trimming error entries on regular basis
Updated by 王子敬 wang over 1 year ago
- File 2.1a0s2_pglog 2.1a0s2_pglog added
Nitzan Mordechai wrote:
@王子敬 wang, can you please send us the output for one of the pgs from ceph-objectstore-tool?
[...]we need to count find out if the issue here is really error entries or dups
you can check that against the output json with
[...]i ran a quick check, it looks like we are trimming error entries on regular basis
this is the pglog,the part of the pg2.1a0s2
Updated by 王子敬 wang over 1 year ago
王子敬 wang wrote:
Nitzan Mordechai wrote:
@王子敬 wang, can you please send us the output for one of the pgs from ceph-objectstore-tool?
[...]we need to count find out if the issue here is really error entries or dups
you can check that against the output json with
[...]i ran a quick check, it looks like we are trimming error entries on regular basis
this is the pglog,the part of the pg2.1a0s2
This is what I saved before。
Updated by Nitzan Mordechai over 1 year ago
Since you attached part of the pglog, i can't see how many entries you have for log and how many for dups
can you please run the ceph-objectstore-tool with
| jq '(.pg_log_t.log|length),(.pg_log_t.dups|length)'so we can see how many entries we have for each section ?
Updated by Radoslaw Zarzynski over 1 year ago
- Status changed from New to Need More Info
Updated by 王子敬 wang over 1 year ago
Nitzan Mordechai wrote:
Since you attached part of the pglog, i can't see how many entries you have for log and how many for dups
can you please run the ceph-objectstore-tool with [...] so we can see how many entries we have for each section ?
[root@node1 ~]# cat 2.1a0s2 | jq '(.pg_log_t.log|length),(.pg_log_t.dups|length)'
1632
1369
file 2.1a0s2 is pg2.1a0s2 pg_log, Is this ok? If necessary, I will repeat the problem and get the relevant log information
Updated by Nitzan Mordechai over 1 year ago
王子敬 wang wrote:
Nitzan Mordechai wrote:
Since you attached part of the pglog, i can't see how many entries you have for log and how many for dups
can you please run the ceph-objectstore-tool with [...] so we can see how many entries we have for each section ?[root@node1 ~]# cat 2.1a0s2 | jq '(.pg_log_t.log|length),(.pg_log_t.dups|length)'
1632
1369file 2.1a0s2 is pg2.1a0s2 pg_log, Is this ok? If necessary, I will repeat the problem and get the relevant log information
2.1a0s2 was trimmed, it doesn't looks like it contain all your pg log entries, can you please run ceph-objectstore-tool again but this time sent us the full pglog
Updated by 王子敬 wang over 1 year ago
- File 1668130751396.jpg 1668130751396.jpg added
- File 1666334986727.jpg 1666334986727.jpg added
Nitzan Mordechai wrote:
王子敬 wang wrote:
Nitzan Mordechai wrote:
Since you attached part of the pglog, i can't see how many entries you have for log and how many for dups
can you please run the ceph-objectstore-tool with [...] so we can see how many entries we have for each section ?[root@node1 ~]# cat 2.1a0s2 | jq '(.pg_log_t.log|length),(.pg_log_t.dups|length)'
1632
1369file 2.1a0s2 is pg2.1a0s2 pg_log, Is this ok? If necessary, I will repeat the problem and get the relevant log information
2.1a0s2 was trimmed, it doesn't looks like it contain all your pg log entries, can you please run ceph-objectstore-tool again but this time sent us the full pglog
2.1a0s2 was run ceph-objectstore-tool got. the ceph-objectstore-tool only get on disk pglog. the most pglogs are in memory,I can't get it。Is there any way you can get it? please tell me.
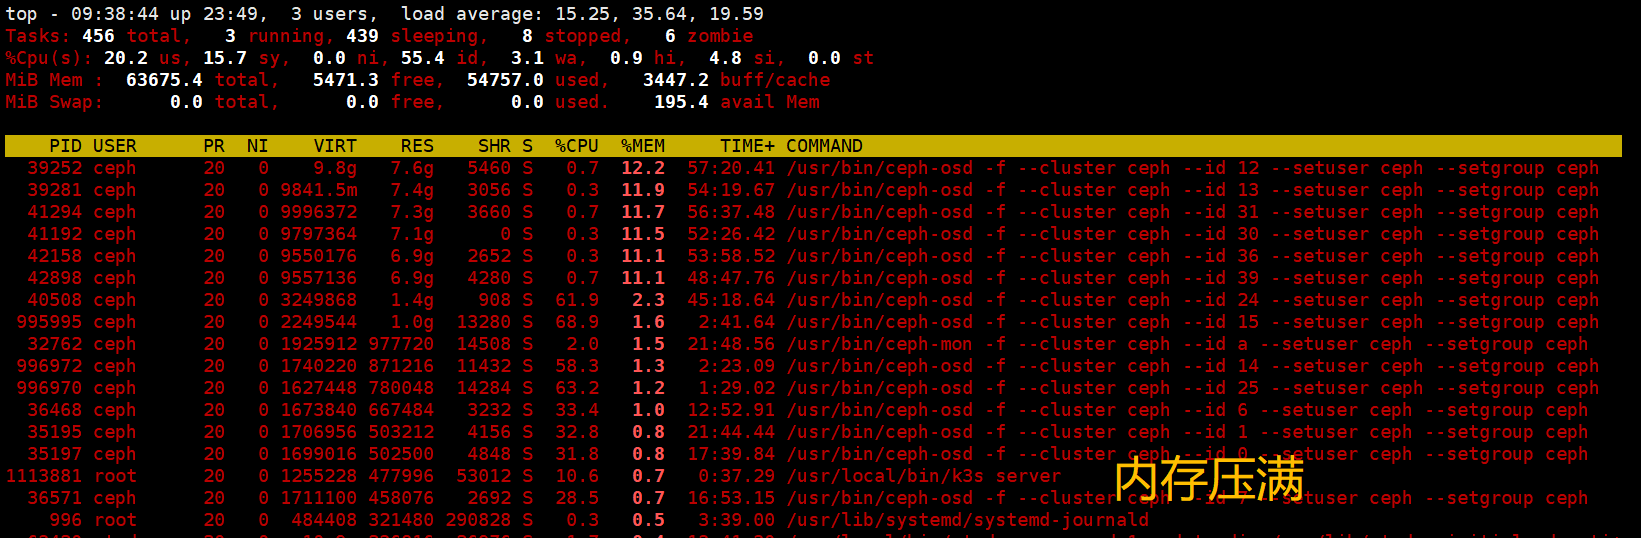
When I stop append and copy objects, the memory state is shown in the picture.the memory is high.
after that, When I try to put some objects, the memory starts to be recycled slowly. pglog trimed.
Updated by Radoslaw Zarzynski over 1 year ago
Hello!
what is on disk is actually serialized from the the in-memory representation. We don't see huge numbers of entries here.
The in-memory pg-log can be diagnosed by looking at an output of dump_mempools. On the screenshot it's under 1 GB.
Why do think these values are too high? Are worried what top says about the VIRT column?
Updated by 王子敬 wang over 1 year ago
- File image-2022-10-13-15-02-19-462.png image-2022-10-13-15-02-19-462.png added
- File image-2022-10-13-15-02-36-902.png image-2022-10-13-15-02-36-902.png added
- File image-2022-10-13-15-01-58-184.png image-2022-10-13-15-01-58-184.png added
Radoslaw Zarzynski wrote:
Hello!
what is on disk is actually serialized from the the in-memory representation. We don't see huge numbers of entries here.
The in-memory pg-log can be diagnosed by looking at an output of
dump_mempools. On the screenshot it's under 1 GB.Why do think these values are too high? Are worried what
topsays about theVIRTcolumn?
Sorry, this is the screenshot of dump_mempools in the environment.
Most OSDs have hundreds of thousands or even millions of pglogs, In addition, (byte/items)the number of bytes in a single pglog is also large. this is also where I wonder
Updated by Radoslaw Zarzynski over 1 year ago
Well, values around 600-900 kitems aren't looking very large to me. Definitely they are much, much smaller than anything we saw in the dups issue where dozens of millions were typical.