Actions
Bug #54542
openDashboard MDS performance counters graph draws fill above values and jumps backwards x axis
Status:
New
Priority:
Normal
Assignee:
-
Category:
-
Target version:
-
% Done:
0%
Source:
Tags:
Backport:
Regression:
No
Severity:
3 - minor
Reviewed:
Description
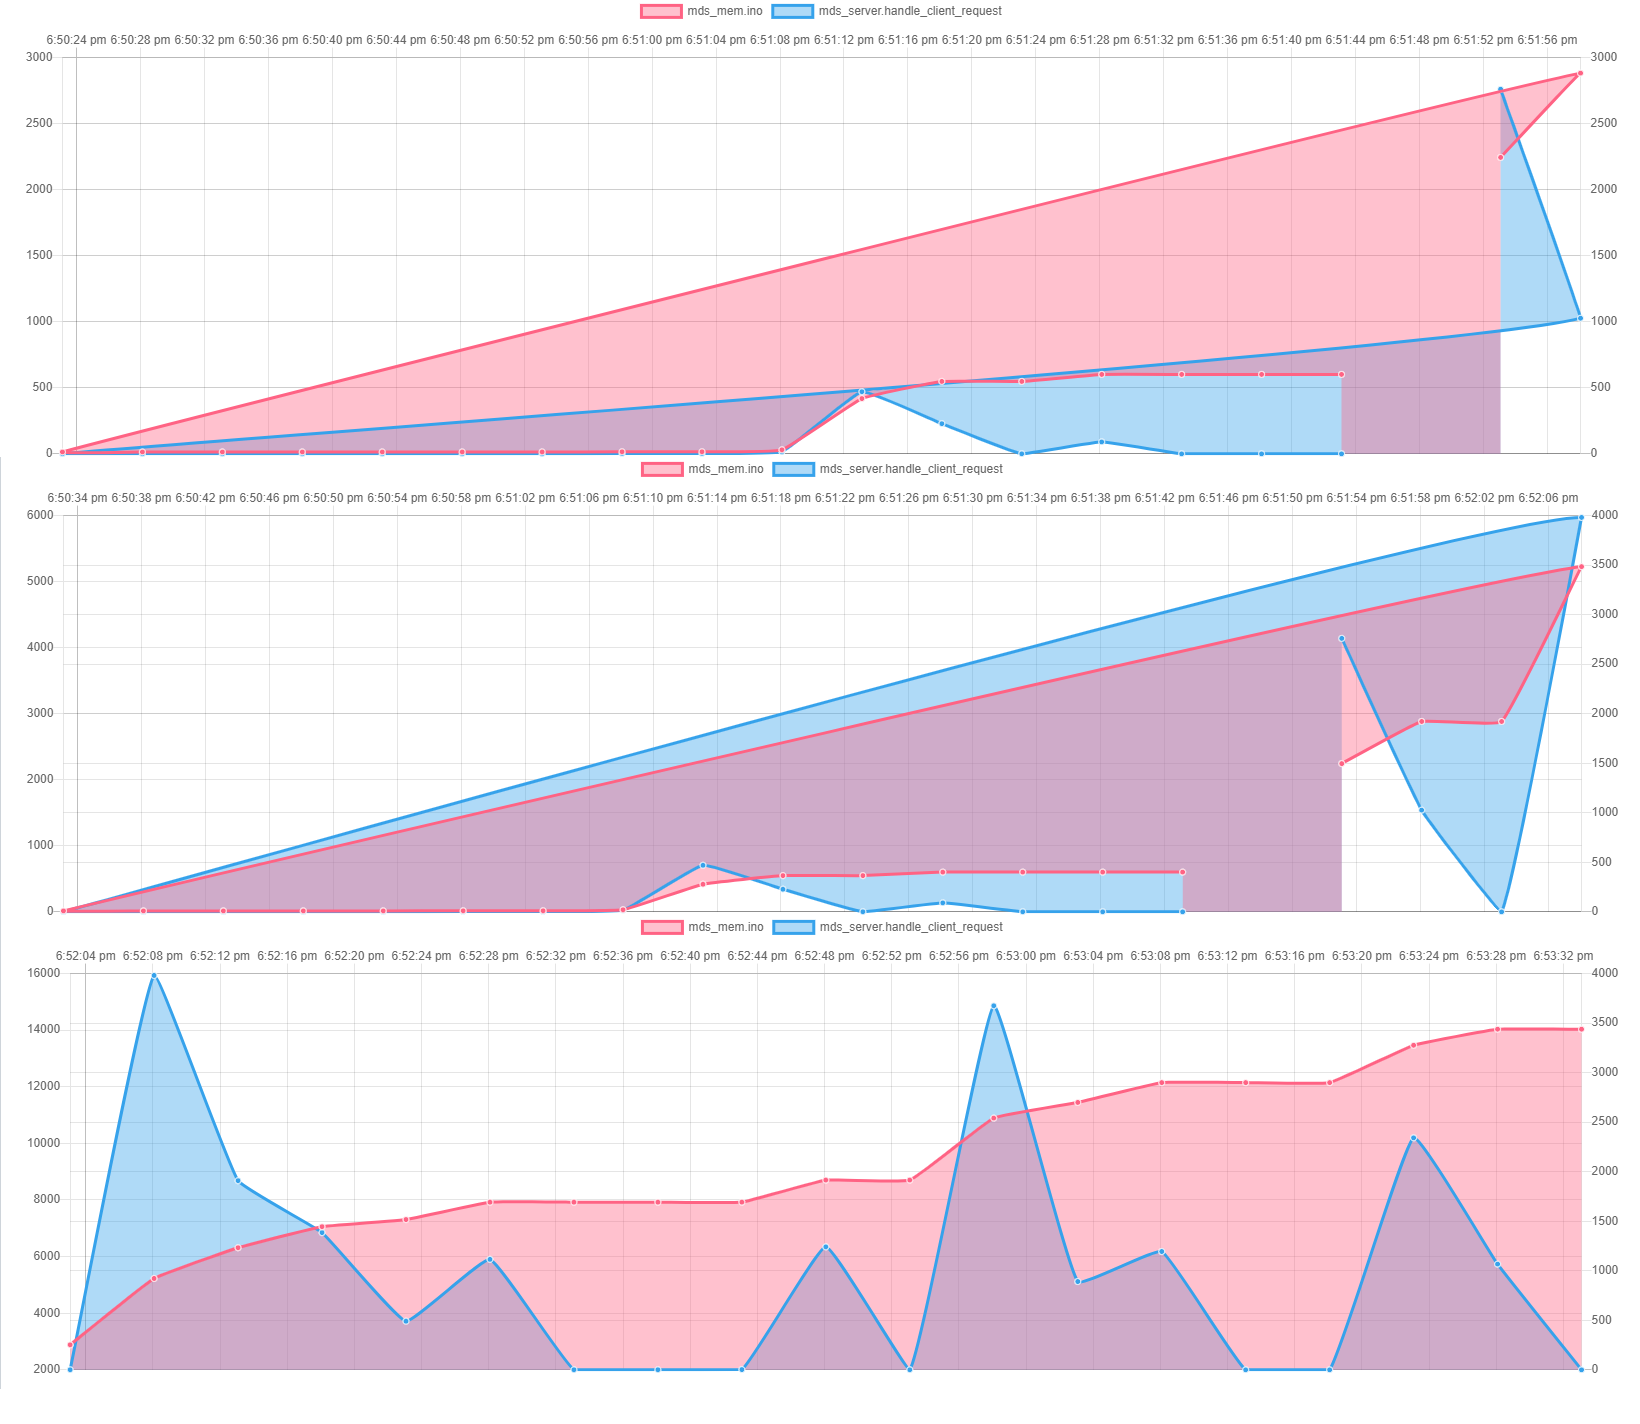
The "MDS performance counters" graph (in File Systems -> <fs name> > Details) occasionally draws the fill above the line graph (not between y axis zero and current value, but above the current value) and the latest data point on x axis jumps backwards in time.
Attached is a series of 3 screenshots in chronological order from oldest on top to latest at the bottom.- Screenshot 1: shows the error where the fill is above the line and not below it (towards y axis zero). It also shows the latest value on x axis jumping backwards in time.
- Screenshot 2: same error but later point in time.
- Screenshot 3: without any changes to configuration, later the chart started drawing correctly.
Files
Updated by Voja Molani about 2 years ago
Seen on Chrome 98.0.4758.80 on Windows.
Updated by Voja Molani about 2 years ago
Seems I created this issue in the wrong project - should have been in Ceph-mgr-Dashboard. I hope someone could move it to the right place.
Actions