Actions
Bug #52946
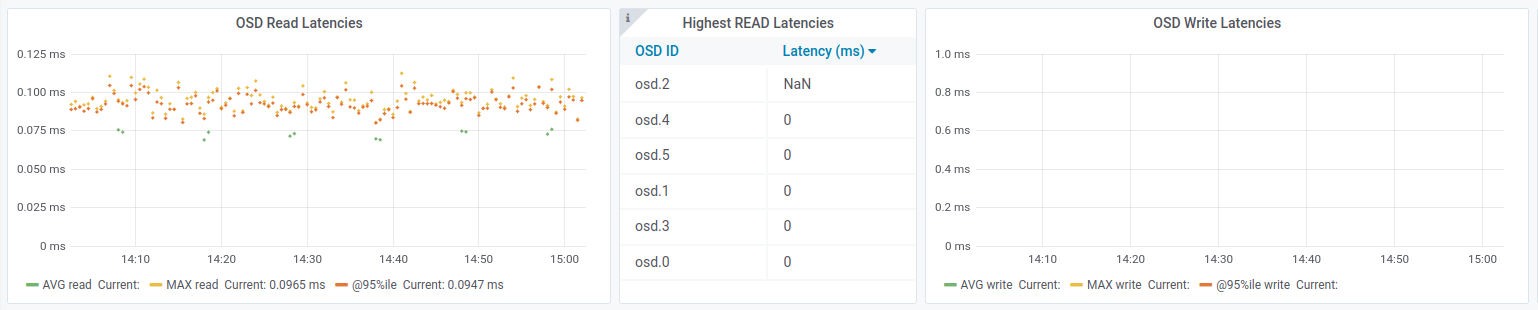
openmgr/dashboard: Grafana "Highest Read/Write Latencies" tables show NaN only
% Done:
0%
Source:
Support
Tags:
Backport:
pacific
Regression:
No
Severity:
3 - minor
Reviewed:
Affected Versions:
ceph-qa-suite:
Pull request ID:
Crash signature (v1):
Crash signature (v2):
Description
The Highest Read/Write Latencies tables show NaN only, although there is plenty of data in the latency vs time plots.
Files
No data to display
Actions