Bug #21225
closed
ceph-mgr: dashboard and zabbix plugin report wrong values
Added by Tobias Rehn over 6 years ago.
Updated about 6 years ago.
Description
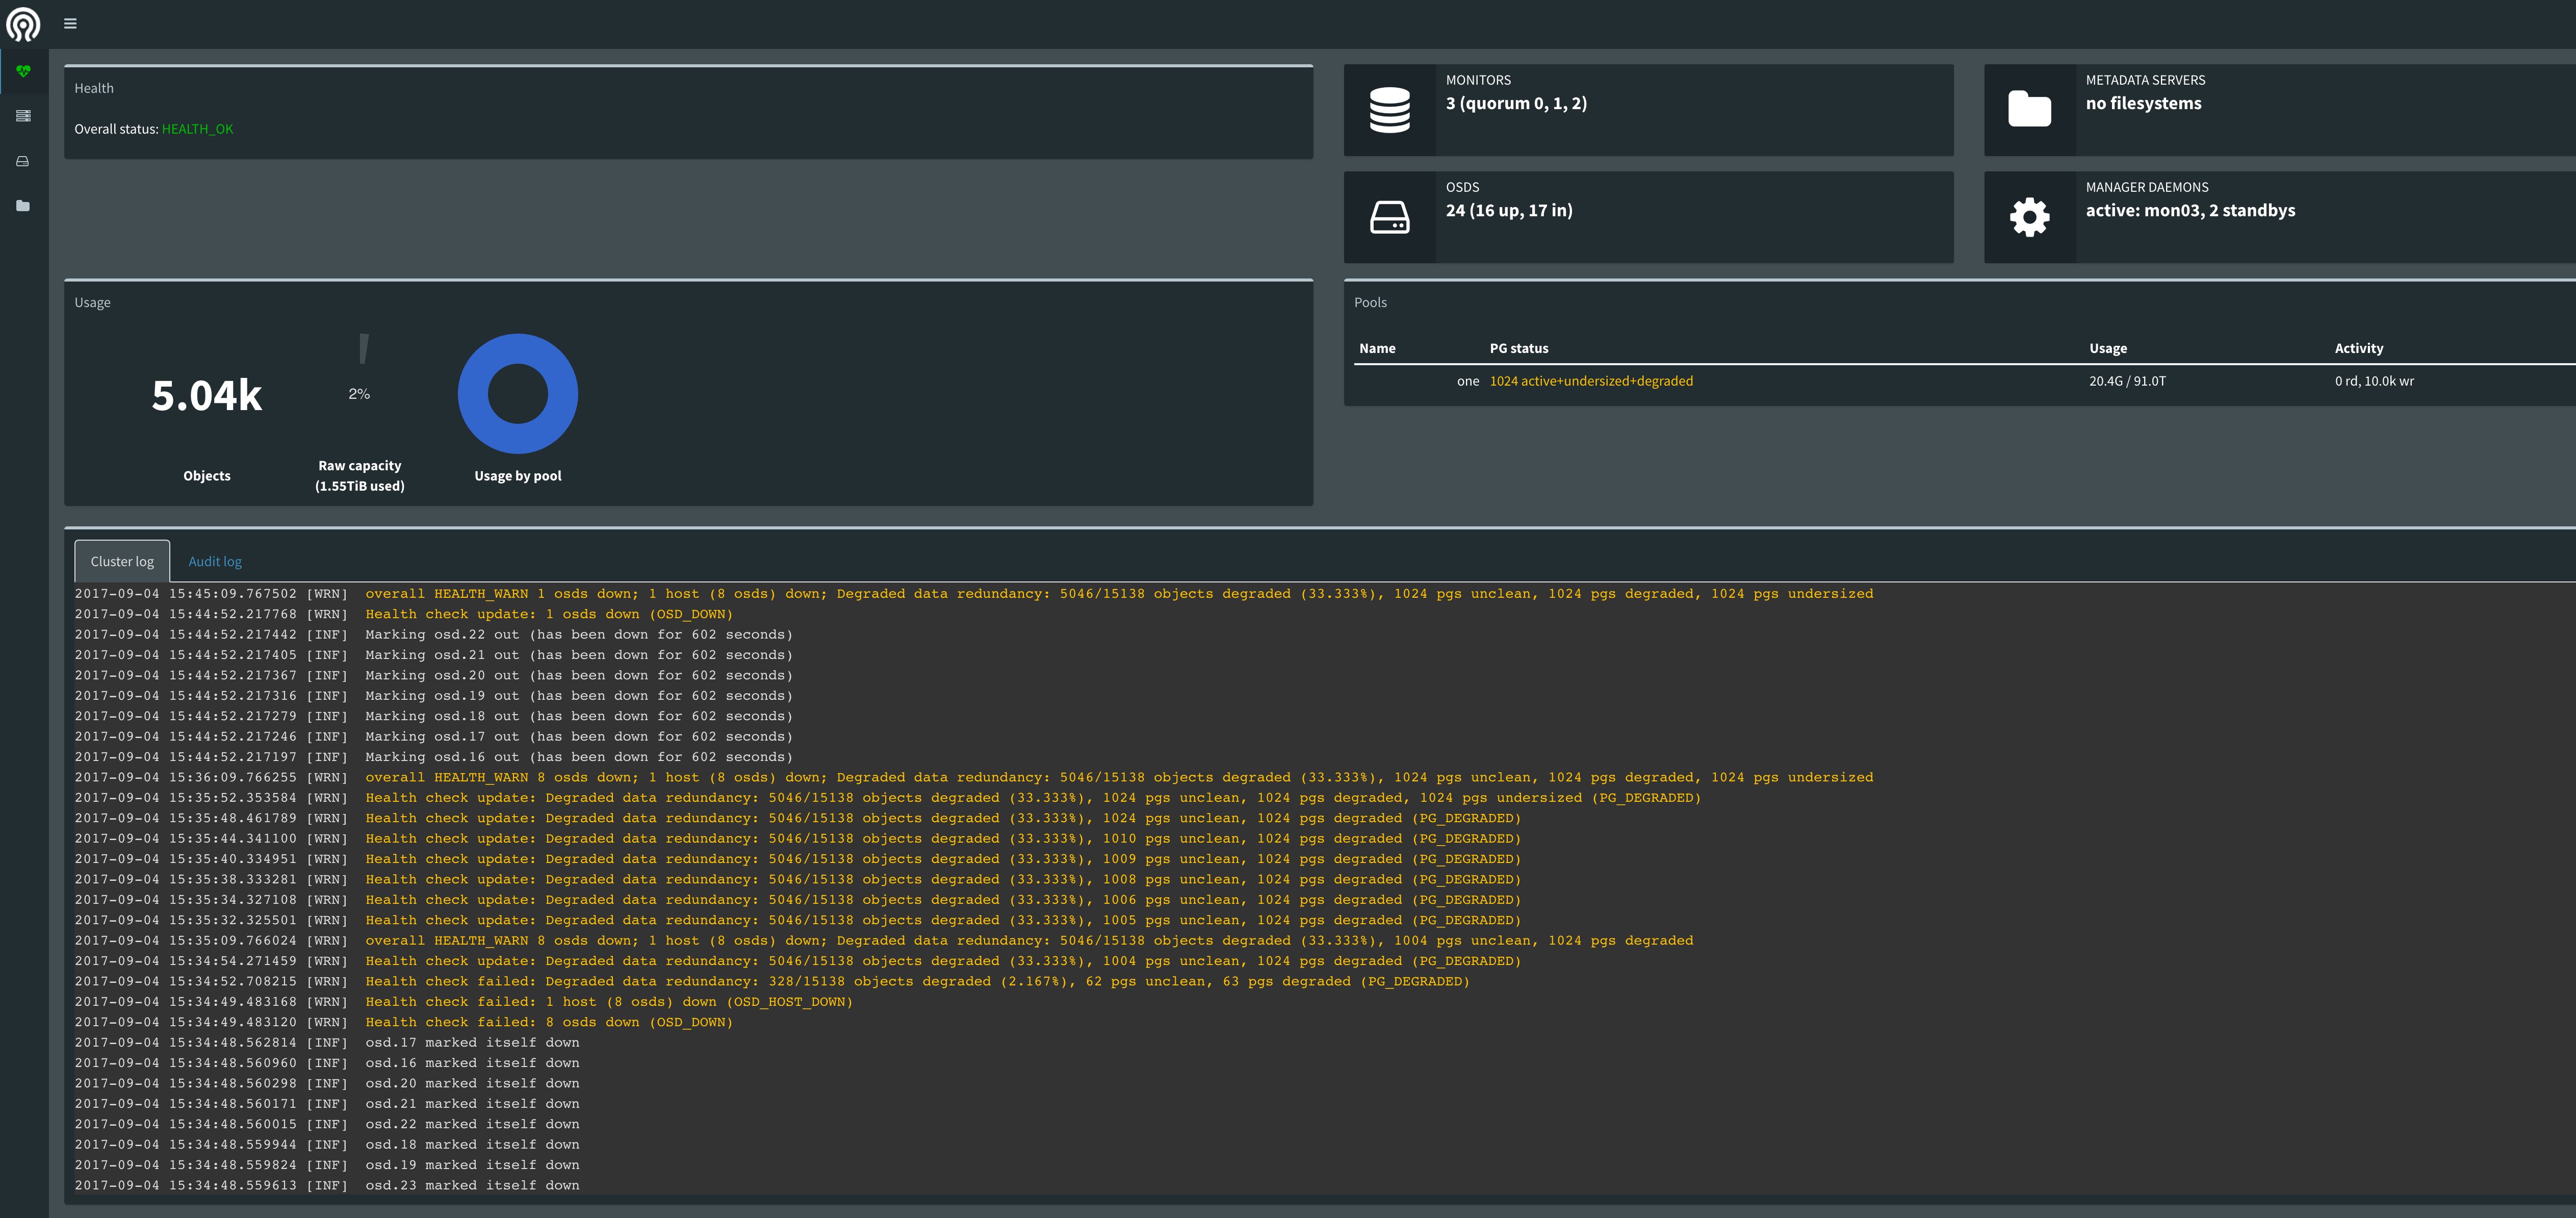
I have installed a ceph cluster using the latest stable (luminous 12.2.0). I enabled the dashboard and zabbix plugin. Both report wrong values for ceph health. The cluster is in HEALTH_WARN state whereas both zabbix and the dashboard show HEALTH_OK.
I have added a screenshot from the new dashboard which show a degraded pool and the overall status "HEALTH_OK".
Files
- Project changed from Ceph to mgr
How odd...
Please could you add these settings on mon and mgr nodes:
debug mon = 10
debug mgr = 10
debug ms = 1
Then restart mon+mgr, get it into this state again (system unhealthy but mgr says HEALTH_OK), and attach the mon/mgr logs since the restart.
It is getting strange now. I restarted my mon/mgr nodes and the problem disappeared. It seems to work now and I cannot reproduce the problem currently. Maybe the active mgr had an issue.
I will keep my eyes on the problem and get back to you once I have further information. From my side the ticket can be closed.
- Status changed from New to Can't reproduce
Has this been addressed in another ticket? This is exactly what I'm experiencing all the time.
Same issue here with 12.2.2. I just restarted all mgr and mon with debuglevel 10. After restart, the dashboard correctly displays the HEALTH_WARN state.
Thanks John... :)
Time to upgrade...
Also available in: Atom
PDF