Bug #63828
openmgr/dashboard: Error 500 when trying to access the dashboard in the RGW panel mgr/dashboard: short_description
0%
Description
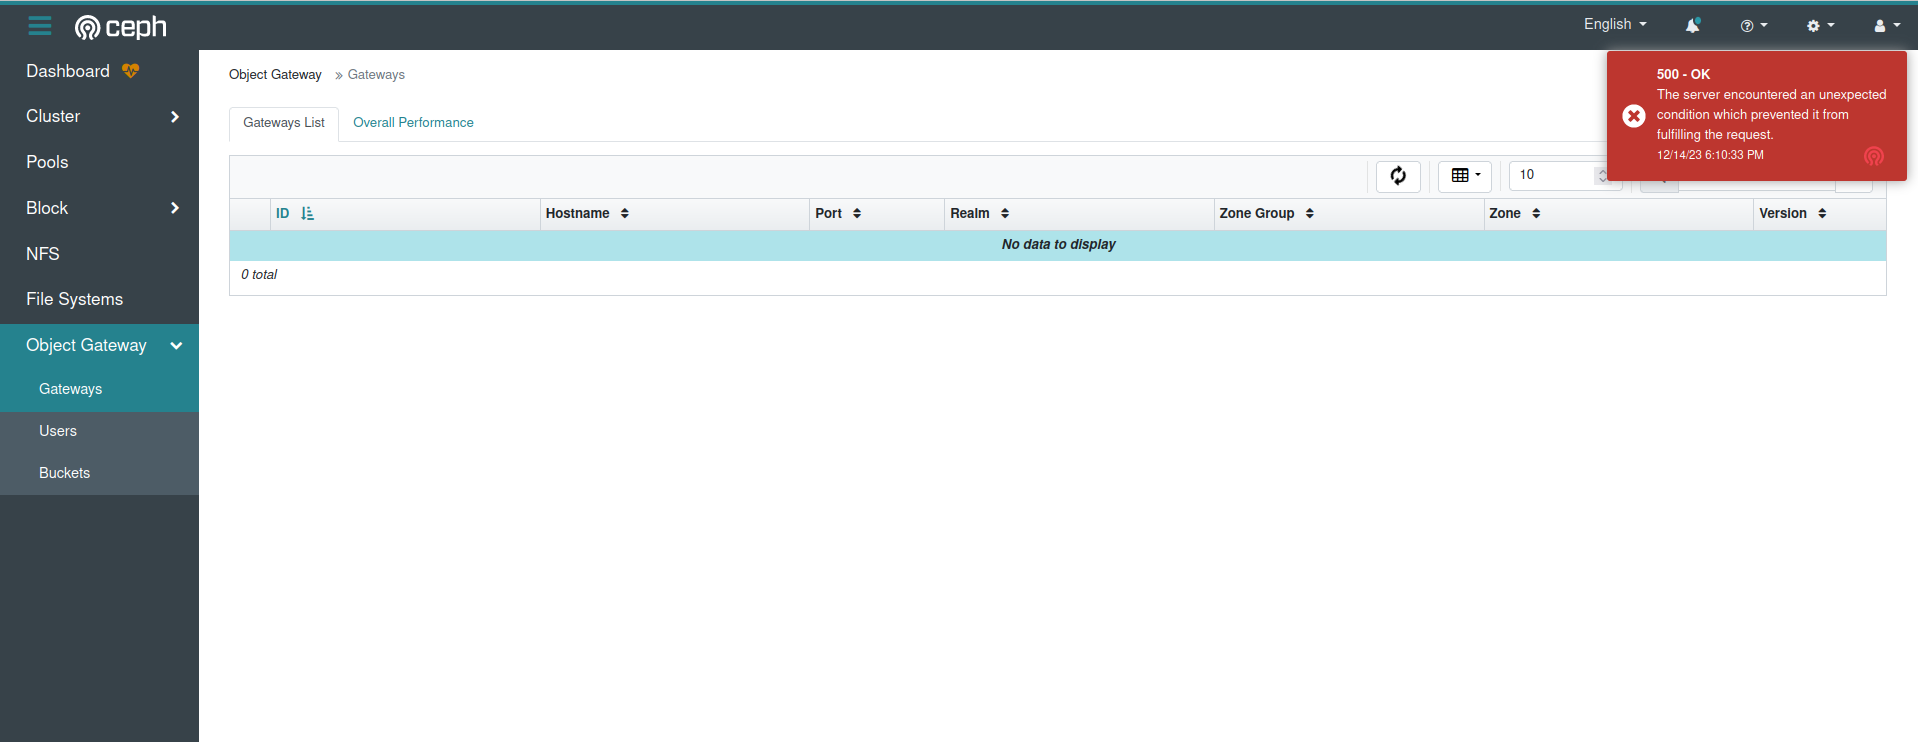
Recently we upgraded from 17.2.6 to 17.2.7 and encountered issues accessing the dashboard to the rgw functionality. When attempting to open the Object Gateway -> Gateways tab, a 500 error is displayed. In the logs, I see the following:
2023-12-14T17:42:19.891+0300 7fed30970700  0 [dashboard ERROR exception] Internal Server Error
Traceback (most recent call last):
  File "/usr/share/ceph/mgr/dashboard/services/exception.py", line 47, in dashboard_exception_handler
    return handler(*args, **kwargs)
  File "/usr/lib/python3/dist-packages/cherrypy/_cpdispatch.py", line 60, in __call__
    return self.callable(*self.args, **self.kwargs)
  File "/usr/share/ceph/mgr/dashboard/controllers/_base_controller.py", line 258, in inner
    ret = func(*args, **kwargs)
  File "/usr/share/ceph/mgr/dashboard/controllers/_rest_controller.py", line 190, in wrapper
    return func(*vpath, **params)
  File "/usr/share/ceph/mgr/dashboard/controllers/rgw.py", line 108, in list
    'port': int(metadata['frontend_config#0'].split('port=')[1])
IndexError: list index out of range
2023-12-14T17:42:19.891+0300 7fed30970700  0 [dashboard ERROR request] [::ffff:10.201.34.90:52692] [GET] [500] [0.015s] [admin] [513.0B] /api/rgw/daemon
2023-12-14T17:42:19.891+0300 7fed30970700  0 [dashboard ERROR request] [b'{"status": "500 Internal Server Error", "detail": "The server encountered an unexpected condition which prevented it from fulfilling the request.", "request_id": "a9044fa2-edbd-4df1-8698-03ea336cc418"}
I noticed that some users have encountered a similar problem here - https://tracker.ceph.com/issues/63698, and here - https://tracker.ceph.com/issues/62735. I tried using the fix from this commit - https://github.com/ceph/ceph/pull/54176/commits/96bf280ac706d02b009c3c02e8f4e971cf9423db but it didn't help.
An example of my rgw configuration looks like this:
[client.rgw-3.rgw0]
host = ceph-rgw-3
keyring = /var/lib/ceph/radosgw/ceph-rgw.ceph-rgw-3.rgw0/keyring
log file = /var/log/ceph/ceph-rgw.ceph-rgw-3.rgw0.log
rgw thread pool size = 2048
rgw_realm = counry
rgw_zonegroup = region
rgw_zone = zone-1
rgw_frontends = beast endpoint=192.168.20.3:8080
We encountered this issue before when transitioning from 17.2.0 -> 17.2.6 and back then the problem was resolved by adding the FQDN and short names for all rgw fronts:
{
"apiname" : "regionname",
"defaultplacement" : "default-placement",
"endpoints" :
,
"hostnames" :
"rgw3.domain.com",
"rgw1-name",
"rgw2-name",
"rgw3-name"
}
What could be the problem right now and how can it be solved?
Files
Updated by Andrey Ogay 5 months ago
We had the same problem when RGW is deployed on 443 with a certificate.
сorrected line 108
'port': int(metadata['frontend_config#0'].split('port=')[1].split(' ')[0])
Updated by Evgeny Zakharov 5 months ago
Andrey Ogay wrote:
We had the same problem when RGW is deployed on 443 with a certificate.
сorrected line 108
'port': int(metadata['frontend_config#0'].split('port=')[1].split(' ')[0])
Did I understand correctly that you changed line 108 here: usr/share/ceph/mgr/dashboard/controllers/rgw.py and you were able to restore access to the mgr dashboard for rgw?
Updated by Andrey Ogay 5 months ago
Evgeny Zakharov wrote:
Andrey Ogay wrote:
We had the same problem when RGW is deployed on 443 with a certificate.
сorrected line 108
'port': int(metadata['frontend_config#0'].split('port=')[1].split(' ')[0])
Did I understand correctly that you changed line 108 here: usr/share/ceph/mgr/dashboard/controllers/rgw.py and you were able to restore access to the mgr dashboard for rgw?
Yes, I changed the line and re-uploaded the podman/docker image, then specified a new image and made a redeploy
Updated by Evgeny Zakharov 5 months ago
Andrey Ogay wrote:
Evgeny Zakharov wrote:
Andrey Ogay wrote:
We had the same problem when RGW is deployed on 443 with a certificate.
сorrected line 108
'port': int(metadata['frontend_config#0'].split('port=')[1].split(' ')[0])
Did I understand correctly that you changed line 108 here: usr/share/ceph/mgr/dashboard/controllers/rgw.py and you were able to restore access to the mgr dashboard for rgw?
Yes, I changed the line and re-uploaded the podman/docker image, then specified a new image and made a redeploy
Thank you, in the end we simply changed the 'rgw frontend beast endpoint=192.168.20.3:8080' to 'rgw frontend port=8080' and it worked.