Actions
Bug #58841
openmgr/dashboard: PG status in pools view difficult to read
% Done:
0%
Source:
Tags:
Backport:
Regression:
No
Severity:
3 - minor
Reviewed:
Affected Versions:
ceph-qa-suite:
Pull request ID:
Crash signature (v1):
Crash signature (v2):
Description
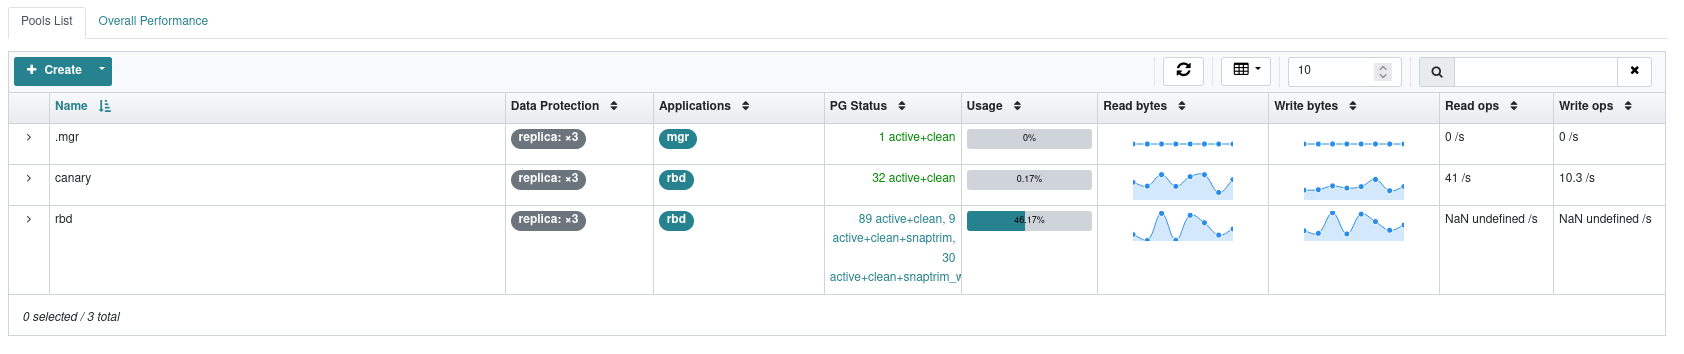
PG status in pools view difficult to read
when a pool has PG's in various states the PG Status colum shows the various states as one long string so entries get split across lines within the 'table cell'.
To make this information more readable, I'd recommend each PG state was presented on its own line.
Environment
ceph versionstring: ceph version 18.0.0-2440-g94c24db3 (94c24db3fe85a6772806e7f8794d74d0408cd734) reef (dev)- Platform (OS/distro/release): RHEL 8.7
- Cluster details (nodes, monitors, OSDs): 3 node cluster, 3 mons, 12 osds
- Did it happen on a stable environment or after a migration/upgrade?: -
- Browser used (e.g.:
Version 86.0.4240.198 (Official Build) (64-bit)): Firefox 110
How reproducible
Steps:
- Look at the pools view on a cluster expanding.shrinking, snaptrimming,etc to see these additional states. #
Actual results
screenshot provided
Expected results
Additional info
Files
Updated by Ernesto Puerta about 1 year ago
What about?:
- Renaming the "PG Status" column to just "Status" or "Availability" (PGs are something that many users struggle with)
- Use the mapping between PG Status and OK/Warning/Error categories that we already use in the lading page:
- If all PGs fall under the OK category, then we simply display a green check/OK.
- Otherwise, we display a progress bar with the percentage of PGs in each category (Ok/Warn/Error)
We can still show a tooltip/mouse-over message to display the detailed account of PG status.
What do you think?
Updated by Paul Cuzner about 1 year ago
Yep that would simplify it. As long as the real PG states can be revealed within the tooltop that makes sense. not sure about a progress bar for things like snaptrim though.
Actions