Bug #46658
closedCeph-OSD nautilus/octopus memory leak ?
0%
Description
Hi everyone,
I'm operating a Ceph cluster (Octopus 15.2.4 7447c15c6ff58d7fce91843b705a268a1917325c) upgraded from Nautilus, Mimic and Luminous year after year and since I upgraded it to Nautilus and now Octopus I'm facing something that appear to be a memory leak.
My issue : hour after hour memory used by ceph-osd daemon grows until it crash due to OOM. It starts with ~2GB of ram and crashed when it consumed ~16GB.
Technical details :
- Cluster is ~2 year old and upgrade from Luminous, Mimic and Nautilus
- My cluster is running ceph Octopus 15.2.4 7447c15c6ff58d7fce91843b705a268a1917325c (including OSD, monitors, MGR, MDS)
- All my servers are running up to date Debian 10 with kernel 4.19.0-9-amd64
- I'm operating a small cluster with 4 only OSDs on SSD disks
- ~100 IOPS and 2MB/s
- I export all rados images every nights, and memory used by OSD grows very quickly during this operation
- This issue appeared just after upgrade from Mimic to Nautilus.
What I checked :
- osd_memory_target = 23546088652 (2GB) setted by osd class (ceph config set osd/class:ssd osd_memory_target 23546088652), I checked with "ceph config get osd.X osd_memory_target"
- ceph daemon osd.X dump_mempools => total memory used is ~1-2GB according to previous setting
- before crash due to OOM memory used by ceph-OSD is > 16GB but "ceph daemon osd.X dump_mempools" stull shows memory usage at ~2GB
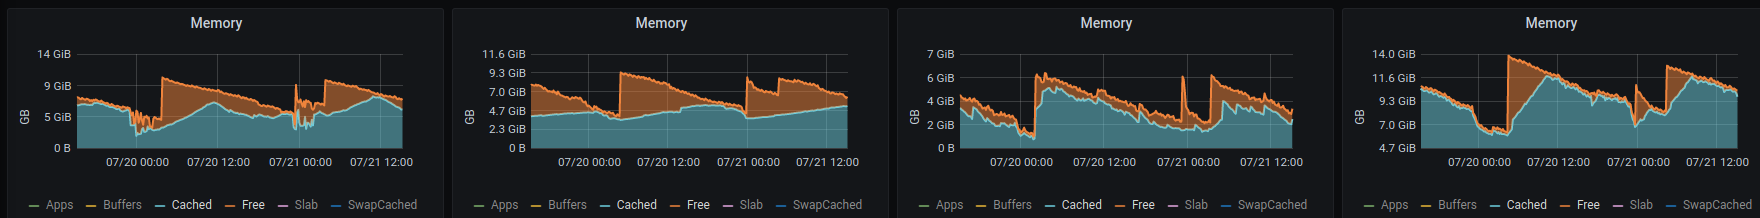
I join a graph that show memory free on my 4 servers, I restart ceph-osd daemons twice a night and now consumption is between 2GB and 7GB.
Logs when it crashed :
Jul 20 00:00:00 [SERVER NAME] ceph-osd3996874: 2020-07-20T00:00:00.624+0000 7f6289a79700 -1 Fail to open '/proc/2600629/cmdline' error = (2) No such file or directory
Jul 20 00:00:00 [SERVER NAME] ceph-osd3996874: 2020-07-20T00:00:00.628+0000 7f6289a79700 -1 received signal: Hangup from <unknown> (PID: 2600629) UID: 0
Jul 20 00:00:00 [SERVER NAME] ceph-osd3996874: 2020-07-20T00:00:00.684+0000 7f6289a79700 -1 received signal: Hangup from pkill -1 -x ceph-mon|ceph-mgr|ceph-mds|ceph-osd|ceph-fuse|radosgw|rbd-mirror (PID: 2600630) UID: 0
Jul 20 00:06:49 [SERVER NAME] systemd1: ceph-osd@0.service: Main process exited, code=killed, status=6/ABRT
Jul 20 00:06:49 [SERVER NAME] systemd1: ceph-osd@0.service: Failed with result 'signal'.
Jul 20 00:07:00 [SERVER NAME] systemd1: ceph-osd@0.service: Service RestartSec=10s expired, scheduling restart.
Jul 20 00:07:00 [SERVER NAME] systemd1: ceph-osd@0.service: Scheduled restart job, restart counter is at 1.
Jul 20 00:07:00 [SERVER NAME] systemd1: Stopped Ceph object storage daemon osd.0.
Jul 20 00:07:00 [SERVER NAME] systemd1: Starting Ceph object storage daemon osd.0...
Jul 20 00:07:00 [SERVER NAME] systemd1: Started Ceph object storage daemon osd.0.
Jul 20 00:07:21 [SERVER NAME] ceph-osd2618153: 2020-07-20T00:07:21.170+0000 7fad1273ae00 -1 osd.0 9901 log_to_monitors {default=true}
Jul 20 00:07:21 [SERVER NAME] ceph-osd2618153: 2020-07-20T00:07:21.206+0000 7fad0bc4b700 -1 osd.0 9901 set_numa_affinity unable to identify public interface 'enp3s0' numa node: (0) Success
My questions :
- How can I confirm memory leak ? Is "ceph daemon osd.X dump_mempools" supposed to show total memory used by ceph-osd daemon ?
- Is there something wrong in my configuration ? (I just setted osd_memory_target to 2GB)
I'll try to reproduce this issue on a install from scratch on a test deployment.
Thanks for your help :)
Files
Updated by Igor Fedotov almost 4 years ago
@Christophe - you might be interested in the following thread: https://lists.ceph.io/hyperkitty/list/ceph-users@ceph.io/thread/TPIFMPQ6YHEK4GYH5LA6NWGRFXVW44MB/
Also wondering if you can do memory profiling as per: https://docs.ceph.com/docs/octopus/rados/troubleshooting/memory-profiling/
Updated by Christophe Hauquiert almost 4 years ago
Igor Fedotov wrote:
@Christophe - you might be interested in the following thread: https://lists.ceph.io/hyperkitty/list/ceph-users@ceph.io/thread/TPIFMPQ6YHEK4GYH5LA6NWGRFXVW44MB/
Also wondering if you can do memory profiling as per: https://docs.ceph.com/docs/octopus/rados/troubleshooting/memory-profiling/
Hi @Igor Gajowiak,
Thank you for your quick feedback (and sorry I was very busy last days), I read the thread and indeed we are facing the same issue, but it seems unresolved yet...
I will try to activate memory profiling and come back with results.
Updated by Neha Ojha almost 4 years ago
- Status changed from New to Need More Info
Updated by Adam Kupczyk almost 4 years ago
@Christophe:
Can you share dump_mempools?
Regarding "osd_memory_target = 23546088652": please note that 23546088652 is ~2.3e10, not 2.3e9.
Updated by Christophe Hauquiert almost 4 years ago
Adam Kupczyk wrote:
@Christophe:
Can you share dump_mempools?
Regarding "osd_memory_target = 23546088652": please note that 23546088652 is ~2.3e10, not 2.3e9.
oO you're right, I'll fix the value.
Just now my ceph-osd daemon is consuming ~3.8GB
- ceph daemon osd.3 dump_mempools
{
"mempool": {
"by_pool": {
"bloom_filter": {
"items": 0,
"bytes": 0
},
"bluestore_alloc": {
"items": 2679100,
"bytes": 81838352
},
"bluestore_cache_data": {
"items": 16145,
"bytes": 505143296
},
"bluestore_cache_onode": {
"items": 492019,
"bytes": 314892160
},
"bluestore_cache_other": {
"items": 49707795,
"bytes": 760594849
},
"bluestore_fsck": {
"items": 0,
"bytes": 0
},
"bluestore_txc": {
"items": 2,
"bytes": 1488
},
"bluestore_writing_deferred": {
"items": 5,
"bytes": 22314
},
"bluestore_writing": {
"items": 12,
"bytes": 49152
},
"bluefs": {
"items": 855,
"bytes": 26008
},
"buffer_anon": {
"items": 31997,
"bytes": 10522303
},
"buffer_meta": {
"items": 45914,
"bytes": 4040432
},
"osd": {
"items": 142,
"bytes": 1835776
},
"osd_mapbl": {
"items": 21,
"bytes": 132967
},
"osd_pglog": {
"items": 528122,
"bytes": 180678992
},
"osdmap": {
"items": 1856,
"bytes": 139664
},
"osdmap_mapping": {
"items": 0,
"bytes": 0
},
"pgmap": {
"items": 0,
"bytes": 0
},
"mds_co": {
"items": 0,
"bytes": 0
},
"unittest_1": {
"items": 0,
"bytes": 0
},
"unittest_2": {
"items": 0,
"bytes": 0
}
},
"total": {
"items": 53503985,
"bytes": 1859917753
}
}
}
Updated by Christophe Hauquiert almost 4 years ago
Adam Kupczyk wrote:
@Christophe:
Can you share dump_mempools?
Regarding "osd_memory_target = 23546088652": please note that 23546088652 is ~2.3e10, not 2.3e9.
Not sure that is related to my issue, because I was running ceph with default configuration (4GB memory target) but it grows to 16GB and crashed.
I fixed the value and I will observe memory next hours.
Updated by Christophe Hauquiert almost 4 years ago
Christophe Hauquiert wrote:
Adam Kupczyk wrote:
@Christophe:
Can you share dump_mempools?
Regarding "osd_memory_target = 23546088652": please note that 23546088652 is ~2.3e10, not 2.3e9.Not sure that is related to my issue, because I was running ceph with default configuration (4GB memory target) but it grows to 16GB and crashed.
I fixed the value and I will observe memory next hours.
Memory is still increasing after I fixed memory target, 5GB today (last OSD restart 15h ago)
Tomorrow I will try to activate memory profiling as you requested.
Updated by Christophe Hauquiert over 3 years ago
Igor Fedotov wrote:
@Christophe - you might be interested in the following thread: https://lists.ceph.io/hyperkitty/list/ceph-users@ceph.io/thread/TPIFMPQ6YHEK4GYH5LA6NWGRFXVW44MB/
Also wondering if you can do memory profiling as per: https://docs.ceph.com/docs/octopus/rados/troubleshooting/memory-profiling/
Hi @Igor Gajowiak,
Sorry for the long wait, I ran memory profiling and I got these results :
(I just ran profilter for a minute because it slows down my cluster, do you need a longer profiling ?)
- ceph tell osd.0 heap stats
osd.0 tcmalloc heap stats:------------------------------------------------
MALLOC: 7214194584 ( 6880.0 MiB) Bytes in use by application
MALLOC: + 352256 ( 0.3 MiB) Bytes in page heap freelist
MALLOC: + 123417608 ( 117.7 MiB) Bytes in central cache freelist
MALLOC: + 10030080 ( 9.6 MiB) Bytes in transfer cache freelist
MALLOC: + 93323360 ( 89.0 MiB) Bytes in thread cache freelists
MALLOC: + 38273024 ( 36.5 MiB) Bytes in malloc metadata
MALLOC: ------------
MALLOC: = 7479590912 ( 7133.1 MiB) Actual memory used (physical + swap)
MALLOC: + 152535040 ( 145.5 MiB) Bytes released to OS (aka unmapped)
MALLOC: ------------
MALLOC: = 7632125952 ( 7278.6 MiB) Virtual address space used
MALLOC:
MALLOC: 584253 Spans in use
MALLOC: 48 Thread heaps in use
MALLOC: 8192 Tcmalloc page size
------------------------------------------------
- ceph tell osd.0 heap dump
osd.0 dumping heap profile now.
------------------------------------------------
MALLOC: 7217409896 ( 6883.1 MiB) Bytes in use by application
MALLOC: + 0 ( 0.0 MiB) Bytes in page heap freelist
MALLOC: + 123497640 ( 117.8 MiB) Bytes in central cache freelist
MALLOC: + 8447488 ( 8.1 MiB) Bytes in transfer cache freelist
MALLOC: + 92888560 ( 88.6 MiB) Bytes in thread cache freelists
MALLOC: + 38273024 ( 36.5 MiB) Bytes in malloc metadata
MALLOC: ------------
MALLOC: = 7480516608 ( 7134.0 MiB) Actual memory used (physical + swap)
MALLOC: + 151609344 ( 144.6 MiB) Bytes released to OS (aka unmapped)
MALLOC: ------------
MALLOC: = 7632125952 ( 7278.6 MiB) Virtual address space used
MALLOC:
MALLOC: 584296 Spans in use
MALLOC: 48 Thread heaps in use
MALLOC: 8192 Tcmalloc page size
------------------------------------------------
- google-pprof --text /usr/bin/ceph-osd /var/log/ceph/osd.0.profile.0001.heap
Using local file /usr/bin/ceph-osd.
Using local file /var/log/ceph/osd.0.profile.0001.heap.
Total: 6.9 MB
5.1 73.9% 73.9% 5.1 73.9% ceph::buffer::v15_2_0::create_aligned_in_mempool
0.7 9.6% 83.5% 0.9 13.1% PGLog::IndexedLog::add
0.2 3.5% 87.0% 0.2 3.5% ceph::buffer::v15_2_0::list::refill_append_space
0.1 2.1% 89.1% 0.1 2.1% std::__detail::_Map_base::operator[]
0.1 2.0% 91.1% 0.2 3.1% PGLog::IndexedLog::trim
0.1 1.7% 92.9% 0.1 1.7% std::_Rb_tree::_M_copy
0.1 1.5% 94.4% 0.1 1.5% std::__cxx11::basic_string::_M_mutate
0.0 0.7% 95.1% 0.0 0.7% OSD::get_tracked_conf_keys
0.0 0.7% 95.8% 0.0 0.7% std::deque::emplace_back
0.0 0.6% 96.3% 0.0 0.6% ceph::make_message
0.0 0.4% 96.7% 0.0 0.5% AsyncConnection::AsyncConnection
0.0 0.4% 97.1% 0.0 0.4% OpRequest::OpRequest
0.0 0.3% 97.4% 4.2 60.5% PrimaryLogPG::do_op
0.0 0.3% 97.6% 0.1 0.9% ReplicatedBackend::generate_subop
0.0 0.2% 97.8% 0.0 0.3% std::vector::emplace_back
0.0 0.2% 98.0% 0.0 0.5% OpTracker::create_request
0.0 0.2% 98.2% 0.0 0.2% BlueStore::ExtentMap::set_lextent
0.0 0.1% 98.3% 0.0 0.2% BlueStore::_generate_read_result_bl
0.0 0.1% 98.4% 0.1 1.4% PeeringState::ReplicaActive::react
0.0 0.1% 98.5% 4.1 60.1% PrimaryLogPG::execute_ctx
0.0 0.1% 98.6% 0.0 0.1% PG::schedule_renew_lease
0.0 0.1% 98.6% 0.0 0.1% BlueStore::_txc_create
0.0 0.1% 98.7% 0.0 0.3% BlueStore::_do_write_big
0.0 0.1% 98.8% 0.0 0.1% std::vector::_M_default_append
0.0 0.1% 98.9% 0.0 0.1% std::_Deque_base::_M_initialize_map
0.0 0.1% 98.9% 0.0 0.1% std::vector::_M_realloc_insert
0.0 0.1% 99.0% 0.0 0.1% BlueStore::BufferSpace::_add_buffer
0.0 0.1% 99.0% 0.0 0.1% std::_Rb_tree::_M_emplace_hint_unique
0.0 0.1% 99.1% 0.0 0.1% AvlAllocator::_try_insert_range
0.0 0.1% 99.2% 0.0 0.1% ProtocolV1::ProtocolV1
0.0 0.1% 99.2% 0.0 0.1% std::_Rb_tree::_M_emplace_unique
0.0 0.0% 99.3% 0.0 0.0% ceph::buffer::v15_2_0::ptr_node::create_hypercombined
0.0 0.0% 99.3% 0.0 0.0% PrimaryLogPG::new_repop
0.0 0.0% 99.3% 0.0 0.0% ceph::buffer::v15_2_0::ptr_node::cloner::operator
0.0 0.0% 99.4% 0.0 0.5% ceph::make_ref
0.0 0.0% 99.4% 0.0 0.0% std::vector::vector
0.0 0.0% 99.5% 0.0 0.0% std::_Rb_tree::_M_insert_unique
0.0 0.0% 99.5% 0.0 0.4% ReplicatedBackend::repop_commit
0.0 0.0% 99.5% 0.3 4.8% EventCenter::process_events
0.0 0.0% 99.6% 0.0 0.0% ceph::buffer::v15_2_0::list::append@11fd000
0.0 0.0% 99.6% 0.0 0.0% std::__cxx11::basic_string::reserve
0.0 0.0% 99.6% 0.0 0.1% BlueStore::_txc_state_proc
0.0 0.0% 99.6% 0.0 0.0% std::__cxx11::list::_M_insert
0.0 0.0% 99.7% 0.0 0.0% BlueStore::_deferred_queue
0.0 0.0% 99.7% 0.5 7.1% ReplicatedBackend::submit_transaction
0.0 0.0% 99.7% 0.0 0.0% BlueStore::_get_deferred_op
0.0 0.0% 99.7% 0.0 0.0% SafeTimer::add_event_at
0.0 0.0% 99.7% 1.2 16.9% ReplicatedBackend::do_repop
0.0 0.0% 99.8% 0.2 2.3% ProtocolV2::send_message
0.0 0.0% 99.8% 0.0 0.0% CryptoAES::get_key_handler
0.0 0.0% 99.8% 0.0 0.0% SharedLRU::lookup_or_create
0.0 0.0% 99.8% 0.0 0.0% ceph::buffer::v15_2_0::list::append@11fd0e0
0.0 0.0% 99.8% 0.0 0.0% boost::detail::function::function_obj_invoker4::invoke
0.0 0.0% 99.8% 0.0 0.0% OSD::get_osd_compat_set
0.0 0.0% 99.8% 0.0 0.0% ceph::Formatter::create
0.0 0.0% 99.9% 0.5 7.1% PrimaryLogPG::issue_repop
0.0 0.0% 99.9% 0.0 0.0% Watch::register_cb
0.0 0.0% 99.9% 0.0 0.5% BlueStore::_buffer_cache_write
0.0 0.0% 99.9% 0.0 0.0% std::__cxx11::basic_string::_M_construct
0.0 0.0% 99.9% 0.0 0.0% BlueStore::_read_cache
0.0 0.0% 99.9% 0.0 0.0% std::_Rb_tree::_M_insert_
0.0 0.0% 99.9% 0.0 0.0% BlueStore::DeferredBatch::prepare_write
0.0 0.0% 99.9% 0.0 0.0% ProtocolV1::reset_security
0.0 0.0% 99.9% 0.2 2.7% ceph::buffer::v15_2_0::list::append@11fdcb0
0.0 0.0% 99.9% 0.0 0.1% OSD::handle_osd_ping
0.0 0.0% 99.9% 0.0 0.0% bluestore_blob_use_tracker_t::allocate
0.0 0.0% 99.9% 0.0 0.0% std::__cxx11::basic_string::_M_assign
0.0 0.0% 99.9% 0.0 0.6% decode_message
0.0 0.0% 99.9% 0.0 0.0% PrimaryLogPG::get_snapset_context
0.0 0.0% 99.9% 0.0 0.0% Protocol::Protocol
0.0 0.0% 99.9% 0.0 0.0% PrimaryLogPG::check_recovery_sources
0.0 0.0% 100.0% 0.0 0.0% bluestore_blob_t::allocated
0.0 0.0% 100.0% 0.0 0.0% Message::set_data
0.0 0.0% 100.0% 0.0 0.7% ceph::buffer::v15_2_0::list::append_hole
0.0 0.0% 100.0% 0.0 0.0% std::vector::operator=
0.0 0.0% 100.0% 0.0 0.0% WeightedPriorityQueue::Queue::insert
0.0 0.0% 100.0% 0.0 0.0% EventCenter::create_time_event
0.0 0.0% 100.0% 0.0 0.5% BlueStore::BufferSpace::_discard
0.0 0.0% 100.0% 0.0 0.0% OSD::enqueue_op
0.0 0.0% 100.0% 0.0 0.0% ProtocolV2::reset_security
0.0 0.0% 100.0% 0.0 0.0% safe_item_history::operator=
0.0 0.0% 100.0% 0.0 0.0% PosixServerSocketImpl::accept
0.0 0.0% 100.0% 0.0 0.1% ProtocolV2::write_event
0.0 0.0% 100.0% 0.0 0.0% RocksDBStore::get_transaction
0.0 0.0% 100.0% 0.0 0.0% ceph::buffer::v15_2_0::list::append@11fc400
0.0 0.0% 100.0% 0.0 0.4% ceph::buffer::v15_2_0::list::rebuild_aligned_size_and_memory
0.0 0.0% 100.0% 0.0 0.0% ceph::buffer::v15_2_0::list::substr_of
0.0 0.0% 100.0% 0.0 0.0% ceph::decode
0.0 0.0% 100.0% 0.0 0.0% OSDService::set_statfs
0.0 0.0% 100.0% 0.0 0.0% ceph::buffer::v15_2_0::create_static
0.0 0.0% 100.0% 0.0 0.0% get_auth_session_handler
0.0 0.0% 100.0% 0.0 0.0% ProtocolV1::handle_client_banner
0.0 0.0% 100.0% 0.0 0.0% OSD::heartbeat
0.0 0.0% 100.0% 0.0 0.0% PrimaryLogPG::bless_context
0.0 0.0% 100.0% 0.0 0.0% CryptoKey::_set_secret
0.0 0.0% 100.0% 0.0 0.7% ceph::buffer::v15_2_0::list::obtain_contiguous_space
0.0 0.0% 100.0% 0.0 0.0% AdminSocket::execute_command
0.0 0.0% 100.0% 0.0 0.0% AdminSocket::wakeup
0.0 0.0% 100.0% 0.0 0.0% OSD::get_health_metrics
0.0 0.0% 100.0% 0.0 0.0% AdminSocket::queue_tell_command
0.0 0.0% 100.0% 0.0 0.0% PG::get_log_handler
0.0 0.0% 100.0% 0.0 0.0% PrimaryLogPG::get_object_context
0.0 0.0% 100.0% 0.0 0.0% ProtocolV1::open
0.0 0.0% 100.0% 0.0 0.0% json_spirit::read_range_or_throw
0.0 0.0% 100.0% 0.0 0.0% MgrClient::_send_stats
0.0 0.0% 100.0% 0.0 0.0% MonClient::schedule_tick
0.0 0.0% 100.0% 0.0 0.0% OSD::tick
0.0 0.0% 100.0% 0.0 0.0% OSD::tick_without_osd_lock
0.0 0.0% 100.0% 5.5 80.0% ShardedThreadPool::WorkThreadSharded::entry
0.0 0.0% 100.0% 0.0 0.0% AdminSocket::do_tell_queue
0.0 0.0% 100.0% 0.0 0.0% AdminSocket::entry
0.0 0.0% 100.0% 0.0 0.0% AsyncConnection::_stop
0.0 0.0% 100.0% 0.0 0.1% AsyncConnection::handle_write
0.0 0.0% 100.0% 0.3 4.2% AsyncConnection::process
0.0 0.0% 100.0% 0.2 2.3% AsyncConnection::send_message
0.0 0.0% 100.0% 0.0 0.0% AsyncMessenger::accept_conn
0.0 0.0% 100.0% 0.0 0.5% AsyncMessenger::add_accept
0.0 0.0% 100.0% 0.0 0.1% AvlAllocator::_add_to_tree
0.0 0.0% 100.0% 0.0 0.1% AvlAllocator::_release
0.0 0.0% 100.0% 0.0 0.0% BlueFS::_flush
0.0 0.0% 100.0% 0.0 0.0% BlueFS::_flush_range
0.0 0.0% 100.0% 0.0 0.0% BlueFS::_fsync
0.0 0.0% 100.0% 0.0 0.0% BlueFS::get_usage
0.0 0.0% 100.0% 1.0 14.6% BlueRocksWritableFile::Append
0.0 0.0% 100.0% 0.0 0.0% BlueRocksWritableFile::Flush
0.0 0.0% 100.0% 0.0 0.0% BlueRocksWritableFile::Sync
0.0 0.0% 100.0% 0.0 0.0% BlueStore::Blob::get_ref
0.0 0.0% 100.0% 0.0 0.2% BlueStore::Blob::put_ref
0.0 0.0% 100.0% 0.0 0.0% BlueStore::BufferSpace::read
0.0 0.0% 100.0% 0.0 0.6% BlueStore::ExtentMap::encode_some
0.0 0.0% 100.0% 0.0 0.2% BlueStore::ExtentMap::punch_hole
0.0 0.0% 100.0% 0.0 0.6% BlueStore::ExtentMap::update
0.0 0.0% 100.0% 0.0 0.5% BlueStore::KVFinalizeThread::entry
0.0 0.0% 100.0% 1.0 14.6% BlueStore::KVSyncThread::entry
0.0 0.0% 100.0% 0.0 0.2% BlueStore::OldExtent::create
0.0 0.0% 100.0% 0.0 0.1% BlueStore::_apply_padding
0.0 0.0% 100.0% 0.0 0.0% BlueStore::_balance_bluefs_freespace
0.0 0.0% 100.0% 0.0 0.4% BlueStore::_deferred_submit_unlock
0.0 0.0% 100.0% 0.0 0.1% BlueStore::_do_alloc_write
0.0 0.0% 100.0% 3.6 52.1% BlueStore::_do_read
0.0 0.0% 100.0% 0.1 1.2% BlueStore::_do_write
0.0 0.0% 100.0% 0.1 1.0% BlueStore::_do_write_data
0.0 0.0% 100.0% 0.1 0.8% BlueStore::_do_write_small
0.0 0.0% 100.0% 0.0 0.5% BlueStore::_kv_finalize_thread
0.0 0.0% 100.0% 1.0 14.6% BlueStore::_kv_sync_thread
0.0 0.0% 100.0% 0.0 0.0% BlueStore::_omap_setkeys
0.0 0.0% 100.0% 3.6 51.9% BlueStore::_prepare_read_ioc
0.0 0.0% 100.0% 0.0 0.6% BlueStore::_record_onode
0.0 0.0% 100.0% 0.1 1.7% BlueStore::_setattrs
0.0 0.0% 100.0% 0.2 2.9% BlueStore::_txc_add_transaction
0.0 0.0% 100.0% 1.0 14.6% BlueStore::_txc_apply_kv
0.0 0.0% 100.0% 0.0 0.1% BlueStore::_txc_finish
0.0 0.0% 100.0% 0.0 0.0% BlueStore::_txc_finish_io
0.0 0.0% 100.0% 0.0 0.1% BlueStore::_txc_release_alloc
0.0 0.0% 100.0% 0.0 0.6% BlueStore::_txc_write_nodes
0.0 0.0% 100.0% 0.1 1.2% BlueStore::_write
0.0 0.0% 100.0% 0.0 0.4% BlueStore::deferred_try_submit
0.0 0.0% 100.0% 0.3 5.0% BlueStore::queue_transactions
0.0 0.0% 100.0% 3.6 52.1% BlueStore::read
0.0 0.0% 100.0% 0.0 0.0% CephxAuthorizeHandler::verify_authorizer
0.0 0.0% 100.0% 0.0 0.4% Context::complete
0.0 0.0% 100.0% 0.0 0.0% CryptoAESKeyHandler::decrypt
0.0 0.0% 100.0% 0.0 0.0% CryptoKey::decode
0.0 0.0% 100.0% 0.0 0.0% DispatchQueue::DispatchThread::entry
0.0 0.0% 100.0% 0.0 0.0% DispatchQueue::entry
0.0 0.0% 100.0% 0.0 0.6% DispatchQueue::fast_dispatch
0.0 0.0% 100.0% 0.0 0.0% EpollDriver::event_wait
0.0 0.0% 100.0% 0.0 0.1% HybridAllocator::release
0.0 0.0% 100.0% 0.0 0.0% KernelDevice::AioCompletionThread::entry
0.0 0.0% 100.0% 0.0 0.0% KernelDevice::_aio_thread
0.0 0.0% 100.0% 3.6 51.9% KernelDevice::aio_read
0.0 0.0% 100.0% 0.0 0.4% KernelDevice::aio_write
0.0 0.0% 100.0% 0.0 0.0% MCommand::decode_payload
0.0 0.0% 100.0% 0.0 0.1% MOSDOp::finish_decode
0.0 0.0% 100.0% 0.0 0.0% MOSDOpReply::MOSDOpReply
0.0 0.0% 100.0% 0.1 1.3% MOSDPGLeaseAck::encode_payload
0.0 0.0% 100.0% 0.0 0.1% MOSDPing::encode_payload
0.0 0.0% 100.0% 0.0 0.6% MOSDRepOp::encode_payload
0.0 0.0% 100.0% 0.0 0.3% MOSDRepOpReply::encode_payload
0.0 0.0% 100.0% 0.2 2.2% Message::encode
0.0 0.0% 100.0% 0.0 0.1% MonClient::handle_auth_request
0.0 0.0% 100.0% 0.0 0.0% MonClient::tick
0.0 0.0% 100.0% 0.3 4.8% NetworkStack::create_worker
0.0 0.0% 100.0% 0.0 0.0% OSD::ShardedOpWQ::_enqueue
0.0 0.0% 100.0% 5.5 80.0% OSD::ShardedOpWQ::_process
0.0 0.0% 100.0% 0.0 0.0% OSD::T_Heartbeat::entry
0.0 0.0% 100.0% 0.0 0.0% OSD::_dispatch
0.0 0.0% 100.0% 0.0 0.0% OSD::asok_command
0.0 0.0% 100.0% 5.3 77.4% OSD::dequeue_op
0.0 0.0% 100.0% 0.1 1.5% OSD::dequeue_peering_evt
0.0 0.0% 100.0% 0.0 0.0% OSD::handle_command
0.0 0.0% 100.0% 0.0 0.1% OSD::heartbeat_dispatch
0.0 0.0% 100.0% 0.0 0.0% OSD::heartbeat_entry
0.0 0.0% 100.0% 0.0 0.0% OSD::ms_dispatch
0.0 0.0% 100.0% 0.0 0.5% OSD::ms_fast_dispatch
0.0 0.0% 100.0% 0.0 0.0% OSD::ms_handle_authentication
0.0 0.0% 100.0% 0.0 0.0% OSDCap::parse
0.0 0.0% 100.0% 0.0 0.0% OSDCapGrant::OSDCapGrant@c379e0
0.0 0.0% 100.0% 0.0 0.0% OSDOp::split_osd_op_vector_in_data
0.0 0.0% 100.0% 0.1 0.9% OSDService::send_message_osd_cluster
0.0 0.0% 100.0% 0.0 0.0% OSDSocketHook::call_async
0.0 0.0% 100.0% 0.0 0.0% ObcLockManager::get_lock_type
0.0 0.0% 100.0% 0.0 0.0% ObjectCleanRegions::decode
0.0 0.0% 100.0% 0.0 0.0% ObjectCleanRegions::mark_data_region_dirty
0.0 0.0% 100.0% 0.0 0.0% OpHistory::_insert_delayed
0.0 0.0% 100.0% 0.0 0.0% OpHistoryServiceThread::entry
0.0 0.0% 100.0% 0.0 0.0% OpRequest::mark_flag_point_string
0.0 0.0% 100.0% 0.1 1.5% PG::do_peering_event
0.0 0.0% 100.0% 0.0 0.2% PG::prepare_write
0.0 0.0% 100.0% 0.1 1.3% PG::send_cluster_message
0.0 0.0% 100.0% 1.2 16.9% PGBackend::handle_message
0.0 0.0% 100.0% 0.0 0.1% PGLog::_write_log_and_missing
0.0 0.0% 100.0% 0.2 2.4% PGLog::trim
0.0 0.0% 100.0% 0.0 0.1% PGLog::write_log_and_missing
0.0 0.0% 100.0% 0.0 0.0% PGTransaction::get_object_op_for_modify
0.0 0.0% 100.0% 0.0 0.5% PGTransaction::setattrs
0.0 0.0% 100.0% 0.0 0.0% PGTransaction::write
0.0 0.0% 100.0% 0.0 0.1% PeeringState::Active::react
0.0 0.0% 100.0% 0.9 13.1% PeeringState::add_log_entry
0.0 0.0% 100.0% 1.1 15.7% PeeringState::append_log
0.0 0.0% 100.0% 0.0 0.2% PeeringState::write_if_dirty
0.0 0.0% 100.0% 0.0 0.4% PrimaryLogPG::BlessedContext::finish
0.0 0.0% 100.0% 0.0 0.0% PrimaryLogPG::OpContext::OpContext
0.0 0.0% 100.0% 3.6 52.2% PrimaryLogPG::do_osd_ops
0.0 0.0% 100.0% 3.6 52.1% PrimaryLogPG::do_read
0.0 0.0% 100.0% 5.3 77.4% PrimaryLogPG::do_request
0.0 0.0% 100.0% 0.0 0.0% PrimaryLogPG::find_object_context
0.0 0.0% 100.0% 0.0 0.6% PrimaryLogPG::finish_ctx
0.0 0.0% 100.0% 1.1 16.3% PrimaryLogPG::log_operation
0.0 0.0% 100.0% 3.6 52.8% PrimaryLogPG::prepare_transaction
0.0 0.0% 100.0% 0.3 5.0% PrimaryLogPG::queue_transactions
0.0 0.0% 100.0% 0.0 0.0% PrimaryLogPG::write_update_size_and_usage
0.0 0.0% 100.0% 0.0 0.5% Processor::accept
0.0 0.0% 100.0% 0.1 1.9% ProtocolV1::accept
0.0 0.0% 100.0% 0.0 0.0% ProtocolV1::fault
0.0 0.0% 100.0% 0.0 0.0% ProtocolV1::handle_connect_message_1
0.0 0.0% 100.0% 0.0 0.0% ProtocolV1::handle_connect_message_2
0.0 0.0% 100.0% 0.0 0.0% ProtocolV1::handle_connect_message_auth
0.0 0.0% 100.0% 0.0 0.0% ProtocolV1::handle_message
0.0 0.0% 100.0% 0.0 0.4% ProtocolV1::handle_message_footer
0.0 0.0% 100.0% 0.1 1.5% ProtocolV1::handle_message_front
0.0 0.0% 100.0% 0.0 0.0% ProtocolV1::handle_seq
0.0 0.0% 100.0% 0.0 0.0% ProtocolV1::read_event
0.0 0.0% 100.0% 0.1 1.5% ProtocolV1::read_message_data_prepare
0.0 0.0% 100.0% 0.0 0.0% ProtocolV1::read_message_front
0.0 0.0% 100.0% 0.1 1.5% ProtocolV1::read_message_middle
0.0 0.0% 100.0% 0.0 0.0% ProtocolV1::ready
0.0 0.0% 100.0% 0.0 0.0% ProtocolV1::reset_recv_state
0.0 0.0% 100.0% 0.0 0.0% ProtocolV1::server_ready
0.0 0.0% 100.0% 0.0 0.0% ProtocolV1::stop
0.0 0.0% 100.0% 0.0 0.0% ProtocolV1::throttle_dispatch_queue
0.0 0.0% 100.0% 0.0 0.0% ProtocolV1::wait_connect_message_auth
0.0 0.0% 100.0% 0.0 0.0% ProtocolV2::ProtocolV2
0.0 0.0% 100.0% 0.0 0.0% ProtocolV2::_fault
0.0 0.0% 100.0% 0.0 0.0% ProtocolV2::_handle_auth_request
0.0 0.0% 100.0% 0.0 0.0% ProtocolV2::handle_auth_request
0.0 0.0% 100.0% 0.0 0.0% ProtocolV2::handle_client_ident
0.0 0.0% 100.0% 0.0 0.0% ProtocolV2::handle_frame_payload
0.0 0.0% 100.0% 0.1 0.8% ProtocolV2::handle_message
0.0 0.0% 100.0% 0.1 0.8% ProtocolV2::handle_read_frame_dispatch
0.0 0.0% 100.0% 0.1 0.8% ProtocolV2::handle_read_frame_epilogue_main
0.0 0.0% 100.0% 0.0 0.0% ProtocolV2::handle_read_frame_preamble_main
0.0 0.0% 100.0% 0.1 1.4% ProtocolV2::handle_read_frame_segment
0.0 0.0% 100.0% 0.2 2.2% ProtocolV2::prepare_send_message
0.0 0.0% 100.0% 0.0 0.0% ProtocolV2::read_event
0.0 0.0% 100.0% 0.0 0.0% ProtocolV2::read_frame
0.0 0.0% 100.0% 0.1 1.3% ProtocolV2::read_frame_segment
0.0 0.0% 100.0% 0.0 0.0% ProtocolV2::ready
0.0 0.0% 100.0% 0.0 0.0% ProtocolV2::reset_recv_state
0.0 0.0% 100.0% 0.2 2.2% ProtocolV2::run_continuation
0.0 0.0% 100.0% 0.0 0.0% ProtocolV2::send_server_ident
0.0 0.0% 100.0% 0.0 0.0% ProtocolV2::server_ready
0.0 0.0% 100.0% 0.0 0.0% ProtocolV2::stop
0.0 0.0% 100.0% 0.0 0.1% ProtocolV2::write_message
0.0 0.0% 100.0% 0.0 0.4% ReplicatedBackend::C_OSD_RepModifyCommit::finish
0.0 0.0% 100.0% 1.2 16.9% ReplicatedBackend::_handle_message
0.0 0.0% 100.0% 0.0 0.0% ReplicatedBackend::do_repop_reply
0.0 0.0% 100.0% 0.1 2.0% ReplicatedBackend::issue_op
0.0 0.0% 100.0% 3.6 52.1% ReplicatedBackend::objects_read_sync
0.0 0.0% 100.0% 0.1 1.4% RocksDBStore::RocksDBTransactionImpl::put_bat
0.0 0.0% 100.0% 0.1 1.4% RocksDBStore::RocksDBTransactionImpl::set@13ef3c0
0.0 0.0% 100.0% 1.0 14.6% RocksDBStore::submit_common
0.0 0.0% 100.0% 1.0 14.6% RocksDBStore::submit_transaction
0.0 0.0% 100.0% 0.0 0.0% RocksDBStore::submit_transaction_sync
0.0 0.0% 100.0% 0.0 0.0% SafeTimer::add_event_after
0.0 0.0% 100.0% 0.0 0.0% SafeTimer::timer_thread
0.0 0.0% 100.0% 0.0 0.0% SafeTimerThread::entry
0.0 0.0% 100.0% 5.5 80.0% ShardedThreadPool::shardedthreadpool_worker
0.0 0.0% 100.0% 0.0 0.0% TrackedOp::mark_event
0.0 0.0% 100.0% 0.0 0.2% bluestore_blob_t::release_extents
0.0 0.0% 100.0% 0.0 0.0% boost::optional_detail::optional_base::optional_base
0.0 0.0% 100.0% 0.0 0.1% boost::statechart::simple_state::local_react_impl_non_empty::local_react_impl
0.0 0.0% 100.0% 0.1 1.5% boost::statechart::simple_state::react_impl
0.0 0.0% 100.0% 0.1 1.5% boost::statechart::state_machine::process_event
0.0 0.0% 100.0% 0.1 1.7% ceph::buffer::v15_2_0::copy
0.0 0.0% 100.0% 0.1 1.3% ceph::buffer::v15_2_0::create
0.0 0.0% 100.0% 5.1 73.9% ceph::buffer::v15_2_0::create_aligned
0.0 0.0% 100.0% 1.1 15.6% ceph::buffer::v15_2_0::create_page_aligned
0.0 0.0% 100.0% 3.7 53.5% ceph::buffer::v15_2_0::create_small_page_aligned
0.0 0.0% 100.0% 0.0 0.1% ceph::buffer::v15_2_0::list::append_zero
0.0 0.0% 100.0% 0.0 0.0% ceph::buffer::v15_2_0::list::buffers_t::clone_from
0.0 0.0% 100.0% 0.0 0.0% ceph::buffer::v15_2_0::list::iterator_impl::copy
0.0 0.0% 100.0% 0.0 0.0% ceph::buffer::v15_2_0::list::iterator_impl::copy_deep
0.0 0.0% 100.0% 0.1 1.0% ceph::buffer::v15_2_0::list::rebuild
0.0 0.0% 100.0% 0.0 0.6% ceph::buffer::v15_2_0::list::reserve
0.0 0.0% 100.0% 0.0 0.0% ceph::buffer::v15_2_0::list::splice
0.0 0.0% 100.0% 0.1 1.7% ceph::buffer::v15_2_0::ptr::ptr
0.0 0.0% 100.0% 0.0 0.0% ceph::common::cmdmap_from_json
0.0 0.0% 100.0% 0.0 0.0% ceph::crypto::onwire::AES128GCM_OnWireRxHandler::authenticated_decrypt_update
0.0 0.0% 100.0% 0.0 0.1% ceph::encode
0.0 0.0% 100.0% 0.0 0.0% ceph::os::Transaction::_get_coll_id
0.0 0.0% 100.0% 0.0 0.5% ceph::os::Transaction::_get_next_op
0.0 0.0% 100.0% 0.0 0.0% ceph::os::Transaction::_get_object_id
0.0 0.0% 100.0% 0.0 0.0% ceph::os::Transaction::decode
0.0 0.0% 100.0% 0.0 0.6% ceph::os::Transaction::encode
0.0 0.0% 100.0% 5.3 77.4% ceph::osd::scheduler::PGOpItem::run
0.0 0.0% 100.0% 0.1 1.5% ceph::osd::scheduler::PGPeeringItem::run
0.0 0.0% 100.0% 0.0 0.0% ceph::osd_cmds::heap
0.0 0.0% 100.0% 0.0 0.0% ceph_heap_profiler_handle_command
0.0 0.0% 100.0% 0.0 0.0% cephx_verify_authorizer
0.0 0.0% 100.0% 6.9 100.0% clone
0.0 0.0% 100.0% 0.0 0.6% generate_transaction
0.0 0.0% 100.0% 0.0 0.0% get_str_vec
0.0 0.0% 100.0% 0.0 0.0% hobject_t::decode
0.0 0.0% 100.0% 0.0 0.7% hobject_t::hobject_t
0.0 0.0% 100.0% 0.0 0.0% interval_set::insert
0.0 0.0% 100.0% 0.0 0.0% interval_set::union_of
0.0 0.0% 100.0% 0.0 0.0% json_spirit::read
0.0 0.0% 100.0% 0.0 0.0% json_spirit::read_range
0.0 0.0% 100.0% 0.0 0.0% object_info_t::object_info_t
0.0 0.0% 100.0% 0.0 0.0% object_info_t::operator=
0.0 0.0% 100.0% 0.0 0.1% pg_fast_info_t::encode
0.0 0.0% 100.0% 0.0 0.0% pg_log_entry_t::decode
0.0 0.0% 100.0% 0.0 0.1% pg_log_entry_t::encode_with_checksum
0.0 0.0% 100.0% 0.0 0.0% pg_log_entry_t::pg_log_entry_t
0.0 0.0% 100.0% 0.0 0.0% pg_stat_t::decode
0.0 0.0% 100.0% 0.0 0.0% pg_stat_t::encode
0.0 0.0% 100.0% 0.0 0.1% prepare_info_keymap
0.0 0.0% 100.0% 1.0 14.6% rocksdb::DBImpl::Write
0.0 0.0% 100.0% 1.0 14.6% rocksdb::DBImpl::WriteImpl
0.0 0.0% 100.0% 1.0 14.6% rocksdb::DBImpl::WriteToWAL@1471624
0.0 0.0% 100.0% 1.0 14.6% rocksdb::DBImpl::WriteToWAL@14717ae
0.0 0.0% 100.0% 0.1 1.4% rocksdb::PutLengthPrefixedSliceParts
0.0 0.0% 100.0% 1.0 14.6% rocksdb::WritableFileWriter::Append
0.0 0.0% 100.0% 0.0 0.0% rocksdb::WritableFileWriter::Flush
0.0 0.0% 100.0% 0.0 0.0% rocksdb::WritableFileWriter::Sync
0.0 0.0% 100.0% 0.0 0.0% rocksdb::WritableFileWriter::SyncInternal
0.0 0.0% 100.0% 1.0 14.6% rocksdb::WritableFileWriter::WriteBuffered
0.0 0.0% 100.0% 0.1 1.4% rocksdb::WriteBatch::Put@15a0ef0
0.0 0.0% 100.0% 0.1 1.4% rocksdb::WriteBatchInternal::Put@15a0d06
0.0 0.0% 100.0% 1.0 14.6% rocksdb::log::Writer::AddRecord
0.0 0.0% 100.0% 1.0 14.6% rocksdb::log::Writer::EmitPhysicalRecord
0.0 0.0% 100.0% 6.9 100.0% start_thread
0.0 0.0% 100.0% 0.0 0.0% std::_Rb_tree::operator=
0.0 0.0% 100.0% 0.1 1.5% std::__cxx11::basic_string::_M_append
0.0 0.0% 100.0% 0.0 0.0% std::__cxx11::basic_stringbuf::overflow
0.0 0.0% 100.0% 0.0 0.0% std::__ostream_insert
0.0 0.0% 100.0% 0.0 0.0% std::basic_streambuf::xsputn
0.0 0.0% 100.0% 0.3 4.9% std::error_code::default_error_condition
0.0 0.0% 100.0% 0.0 0.0% std::function::function
0.0 0.0% 100.0% 0.0 0.0% std::map::operator[]
0.0 0.0% 100.0% 0.0 0.0% void decode_decrypt_enc_bl@135cc40
Updated by Christophe Hauquiert over 3 years ago
I stopped reboot every night, and this morning OSD is consuming ~10GB
- ceph daemon osd.0 dump_mempools
{
"mempool": {
"by_pool": {
"bloom_filter": {
"items": 0,
"bytes": 0
},
"bluestore_alloc": {
"items": 1299454,
"bytes": 70796864
},
"bluestore_cache_data": {
"items": 86463,
"bytes": 1790185472
},
"bluestore_cache_onode": {
"items": 1390699,
"bytes": 890047360
},
"bluestore_cache_other": {
"items": 138006059,
"bytes": 2135342667
},
"bluestore_fsck": {
"items": 0,
"bytes": 0
},
"bluestore_txc": {
"items": 10,
"bytes": 7440
},
"bluestore_writing_deferred": {
"items": 10,
"bytes": 91974
},
"bluestore_writing": {
"items": 41,
"bytes": 167936
},
"bluefs": {
"items": 609,
"bytes": 24320
},
"buffer_anon": {
"items": 63671,
"bytes": 20630691
},
"buffer_meta": {
"items": 150760,
"bytes": 13266880
},
"osd": {
"items": 145,
"bytes": 1874560
},
"osd_mapbl": {
"items": 15,
"bytes": 95399
},
"osd_pglog": {
"items": 476083,
"bytes": 176775352
},
"osdmap": {
"items": 3585,
"bytes": 281288
},
"osdmap_mapping": {
"items": 0,
"bytes": 0
},
"pgmap": {
"items": 0,
"bytes": 0
},
"mds_co": {
"items": 0,
"bytes": 0
},
"unittest_1": {
"items": 0,
"bytes": 0
},
"unittest_2": {
"items": 0,
"bytes": 0
}
},
"total": {
"items": 141477604,
"bytes": 5099588203
}
}
}
- ceph tell osd.0 heap stats
osd.0 tcmalloc heap stats:------------------------------------------------
MALLOC: 10485587488 ( 9999.8 MiB) Bytes in use by application
MALLOC: + 0 ( 0.0 MiB) Bytes in page heap freelist
MALLOC: + 215399496 ( 205.4 MiB) Bytes in central cache freelist
MALLOC: + 10715392 ( 10.2 MiB) Bytes in transfer cache freelist
MALLOC: + 86254744 ( 82.3 MiB) Bytes in thread cache freelists
MALLOC: + 57147392 ( 54.5 MiB) Bytes in malloc metadata
MALLOC: ------------
MALLOC: = 10855104512 (10352.2 MiB) Actual memory used (physical + swap)
MALLOC: + 241876992 ( 230.7 MiB) Bytes released to OS (aka unmapped)
MALLOC: ------------
MALLOC: = 11096981504 (10582.9 MiB) Virtual address space used
MALLOC:
MALLOC: 887440 Spans in use
MALLOC: 50 Thread heaps in use
MALLOC: 8192 Tcmalloc page size
------------------------------------------------
Updated by Christophe Hauquiert over 3 years ago
I just upgraded from 15.2.4 to 15.2.5 and still facing the same memory problem :/
Updated by Igor Fedotov over 3 years ago
@Christophe - given that excessive memory consumption occurs on image export (i.e. reading) I guess this might be related to unaccounted cached metadata.
From your last mempool dump I can see pretty large amount of very small (avg 15 bytes) items (100 per a onode) which look a bit odd -- I expect a bit higher average item here:
"bluestore_cache_other": {
"items": 138006059,
"bytes": 2135342667
},
Perhaps this lacks accounting for some additional metadata and hence cache trimming doesn't work properly. I.e. allows much more resident data in memory.
So some steps/questions to verify this hypothesis.
1) First of all what's the current setting for osd_memory_target? What was it for that mempool dump - I can see mem usage at 5GB there - is this expected?
2) Please collect another mempool when mem usage becomes high.
3) Please reduce (e.g. from 4GB to 2GB) osd_memory_target on-the-fly after mem usage becomes high (much more than it's expected to be with the current osd_memory_target). Will mem usage drop noticeably after that? Collect another mempool dump after a while
4) I'd like to have a finer granularity for bluestore_cache_other stats (as per https://github.com/ceph/ceph/pull/34537) but this hasn't been backported to octopus yet. Will you be able to build a custom Ceph build if I backport this patch to 15.2.5. I'm going to make it anyway for Octopus head but this will take much more time until you'll be able to try it...
And some questions on you cluster use cases:
1) What's the major payload for the cluster: RGW, RBD, CephFS or something else via pure rados?
2) Are you taking snapshots in your cluster extensively?
3) Are majority of your objects tend to be sparse?
Updated by Christophe Hauquiert over 3 years ago
Hi @Igor Gajowiak,
Thank you for your help :) To answer your questions :1) First of all what's the current setting for osd_memory_target?
=> I set osd_memory_target to 2147483648
- ceph config get osd.3 osd_memory_target
2147483648
What was it for that mempool dump - I can see mem usage at 5GB there - is this expected?
=> It was 2147483648 during mempool dump, so no that is not the memory usage expected :/
2) Please collect another mempool when mem usage becomes high.
=> I removed my croned restart for only one OSD and waited for higher mem consumption. Now it consumes ~10GB (other OSDs are consuming ~3GB)
On OSD 3 (not restarted)
- ceph daemon osd.3 dump_mempools
{
"mempool": {
"by_pool": {
"bloom_filter": {
"items": 0,
"bytes": 0
},
"bluestore_alloc": {
"items": 2679015,
"bytes": 81831552
},
"bluestore_cache_data": {
"items": 52073,
"bytes": 2374156288
},
"bluestore_cache_onode": {
"items": 1196211,
"bytes": 736865976
},
"bluestore_cache_other": {
"items": 126178182,
"bytes": 2089789447
},
"bluestore_fsck": {
"items": 0,
"bytes": 0
},
"bluestore_txc": {
"items": 1,
"bytes": 744
},
"bluestore_writing_deferred": {
"items": 2,
"bytes": 8813
},
"bluestore_writing": {
"items": 50,
"bytes": 204800
},
"bluefs": {
"items": 1387,
"bytes": 33544
},
"buffer_anon": {
"items": 62371,
"bytes": 19951163
},
"buffer_meta": {
"items": 116656,
"bytes": 10265728
},
"osd": {
"items": 142,
"bytes": 1836912
},
"osd_mapbl": {
"items": 50,
"bytes": 335244
},
"osd_pglog": {
"items": 471606,
"bytes": 174986448
},
"osdmap": {
"items": 4830,
"bytes": 314376
},
"osdmap_mapping": {
"items": 0,
"bytes": 0
},
"pgmap": {
"items": 0,
"bytes": 0
},
"mds_co": {
"items": 0,
"bytes": 0
},
"unittest_1": {
"items": 0,
"bytes": 0
},
"unittest_2": {
"items": 0,
"bytes": 0
}
},
"total": {
"items": 130762576,
"bytes": 5490581035
}
}
}
On OSD 2 :
{
"mempool": {
"by_pool": {
"bloom_filter": {
"items": 0,
"bytes": 0
},
"bluestore_alloc": {
"items": 2679007,
"bytes": 81830912
},
"bluestore_cache_data": {
"items": 20259,
"bytes": 994299904
},
"bluestore_cache_onode": {
"items": 329519,
"bytes": 202983704
},
"bluestore_cache_other": {
"items": 33711527,
"bytes": 566462328
},
"bluestore_fsck": {
"items": 0,
"bytes": 0
},
"bluestore_txc": {
"items": 0,
"bytes": 0
},
"bluestore_writing_deferred": {
"items": 0,
"bytes": 0
},
"bluestore_writing": {
"items": 22,
"bytes": 90112
},
"bluefs": {
"items": 871,
"bytes": 27736
},
"buffer_anon": {
"items": 34056,
"bytes": 11917627
},
"buffer_meta": {
"items": 54509,
"bytes": 4796792
},
"osd": {
"items": 149,
"bytes": 1927464
},
"osd_mapbl": {
"items": 28,
"bytes": 188603
},
"osd_pglog": {
"items": 464081,
"bytes": 178923368
},
"osdmap": {
"items": 3056,
"bytes": 198696
},
"osdmap_mapping": {
"items": 0,
"bytes": 0
},
"pgmap": {
"items": 0,
"bytes": 0
},
"mds_co": {
"items": 0,
"bytes": 0
},
"unittest_1": {
"items": 0,
"bytes": 0
},
"unittest_2": {
"items": 0,
"bytes": 0
}
},
"total": {
"items": 37297084,
"bytes": 2043647246
}
}
}
=> I ran on OSD 3 :
- ceph config set osd/class:ssd osd_memory_target 1147483648
And I waited for ~10min, no change on memory usage :/
4) "Will you be able to build a custom Ceph build if I backport this patch to 15.2.5."
If I am able to build a deb package I can try to add this feature on a node
1) What's the major payload for the cluster: RGW, RBD, CephFS or something else via pure rados?
=> I use RBD and CephFS
2) Are you taking snapshots in your cluster extensively?
=> I use "rbd export xxxx --pool xxxx" to export the image.
What do you mean by "extensively" ?
3) Are majority of your objects tend to be sparse?
How can I get this information ?
I have "objects: 1.81M objects, 373 GiB", I guess most of them are used by cephFS.
Igor Fedotov wrote:
@Christophe - given that excessive memory consumption occurs on image export (i.e. reading) I guess this might be related to unaccounted cached metadata.
From your last mempool dump I can see pretty large amount of very small (avg 15 bytes) items (100 per a onode) which look a bit odd -- I expect a bit higher average item here:"bluestore_cache_other": {
"items": 138006059,
"bytes": 2135342667
},Perhaps this lacks accounting for some additional metadata and hence cache trimming doesn't work properly. I.e. allows much more resident data in memory.
So some steps/questions to verify this hypothesis.
1) First of all what's the current setting for osd_memory_target? What was it for that mempool dump - I can see mem usage at 5GB there - is this expected?
2) Please collect another mempool when mem usage becomes high.
3) Please reduce (e.g. from 4GB to 2GB) osd_memory_target on-the-fly after mem usage becomes high (much more than it's expected to be with the current osd_memory_target). Will mem usage drop noticeably after that? Collect another mempool dump after a while
4) I'd like to have a finer granularity for bluestore_cache_other stats (as per https://github.com/ceph/ceph/pull/34537) but this hasn't been backported to octopus yet. Will you be able to build a custom Ceph build if I backport this patch to 15.2.5. I'm going to make it anyway for Octopus head but this will take much more time until you'll be able to try it...And some questions on you cluster use cases:
1) What's the major payload for the cluster: RGW, RBD, CephFS or something else via pure rados?
2) Are you taking snapshots in your cluster extensively?
3) Are majority of your objects tend to be sparse?
Updated by Igor Fedotov over 3 years ago
So I can see two problems for now (most likely they're related though):
1) Cache trimming doesn't work properly which lets data in mempool go beyond osd_memory_target(=2G). The majority of mempool data (5,200,811,711 of 5490581035) belong to cache data:
"bluestore_cache_data": {
"items": 52073,
"bytes": 2374156288
},
"bluestore_cache_onode": {
"items": 1196211,
"bytes": 736865976
},
"bluestore_cache_other": {
"items": 126178182,
"bytes": 2089789447
},
...
"total": {
"items": 130762576,
"bytes": 5490581035
}
2) Actual memory usage is even higher - around 2x higher than mempool indication. (10GB vs. 5GB)
To debug 1) suggest to do the following:
- select some OSD for testing as before,
- set osd_memory_target to 4GB
- wait until its memory consumption (both actual and mempool ones) goes above the threshold (e.g. back to 10GB/5GB for RAM/mempool respectively).
- save current RAM usage and mempool dump.
- For OSD in question set debug_bluestore to 20 and osd_memory_target to 2GB
- leave OSD for 1+ min to perform cache trim. Please do not leave for too long since log file might grow significantly.
- make a snapshot for RAM usage and mempool again
- revert debug bluestore back to default.
- please share all the collected dumps, RAM usage numbers and the log.
As a first step for troubleshooting 2) I suggest to try the following patch on a selected OSD: https://github.com/ceph/ceph/pull/37264.
Then let this OSD to reach RAM usage at 10GB and collect (and share) mempool dump once more. The primary question for now is whether the ratio between RAM usage and mempool one would be significantly different from the previous one (10GB vs. 5GB).
Please do not mix this experiment with the previous one!!!
Updated by Christophe Hauquiert over 3 years ago
I just realized that osd_memory_target was setted to ~20GB (as Adam Kupczyk already noticed) because my new configuration wasn't applied :(
I fixed the value (2GB), and memory usage has decreased to ~3GB, I will observe in the coming days.
Updated by Igor Fedotov over 3 years ago
Christophe Hauquiert wrote:
I just realized that osd_memory_target was setted to ~20GB (as Adam Kupczyk already noticed) because my new configuration wasn't applied :(
I fixed the value (2GB), and memory usage has decreased to ~3GB, I will observe in the coming days.
Christophe, any updates?
Updated by Christophe Hauquiert over 3 years ago
Igor Fedotov wrote:
Christophe Hauquiert wrote:
I just realized that osd_memory_target was setted to ~20GB (as Adam Kupczyk already noticed) because my new configuration wasn't applied :(
I fixed the value (2GB), and memory usage has decreased to ~3GB, I will observe in the coming days.Christophe, any updates?
Everything is working fine since I fixed root cause of wrong osd_memory_target.
I think you can close this issue, I'm sorry for wasting your time...
Updated by Igor Fedotov over 3 years ago
- Status changed from Need More Info to Rejected