Bug #23853
closedInefficent implementation - very long query time for "rbd ls -l" queries
0%
Description
We are trying to integrate a storage repository in xenserver.
Summary:
The slowness is a real pain for us, because this prevents the xen storage repository to work efficently.
Gathering information for XEN Pools with hundreds of virtual machines (using "--format json") would be a real pain...
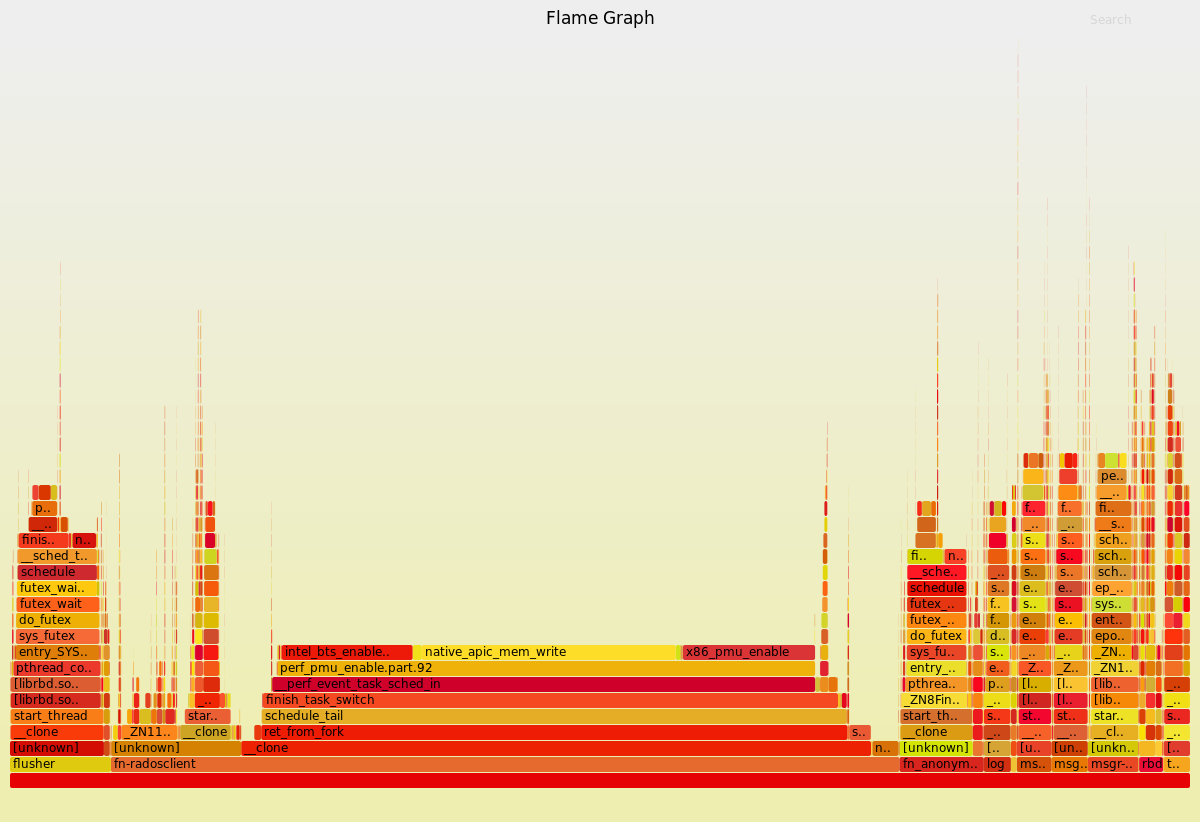
The high user time consumption and the really huge amount of threads suggests that there is something really inefficient in the "rbd" utility.
So what can i do to make "rbd ls -l" faster or to get comparable information regarding snapshot hierarchy information?
We have a strange problem on listing the images of a SSD pool.
# time rbd ls -l --pool RBD_XenStorage-07449252-bf96-4daa-b0a6-687b7f1c369c
NAME                                            SIZE PARENT                                                                                            FMT PROT LOCK
RBD-0192938e-cb4b-4ee1-9988-b8145704ac81      20480M RBD_XenStorage-07449252-bf96-4daa-b0a6-687b7f1c369c/RBD-8b2cfe76-44b7-4393-b376-f675366831c3@BASE   2
RBD-0192938e-cb4b-4ee1-9988-b8145704ac81@BASE 20480M RBD_XenStorage-07449252-bf96-4daa-b0a6-687b7f1c369c/RBD-8b2cfe76-44b7-4393-b376-f675366831c3@BASE   2 yes
..
__srlock__                                         0                                                                                                     2

real    0m8.726s
user    0m8.506s
sys    0m0.591s
===> This incredibly slow for outputting 105 lines.
Without "-l" ist pretty fast (unfortunately i need this information):
# time rbd ls  --pool RBD_XenStorage-07449252-bf96-4daa-b0a6-687b7f1c369c
RBD-0192938e-cb4b-4ee1-9988-b8145704ac81
...
__srlock__

real    0m0.024s
user    0m0.015s
sys    0m0.008s
===> This incredibly fast for outputting 71 lines.
The "@BASE" snapshots are created by the following procedure:
rbd snap create
rbd snap protect
rbd clone
It seems that lookups to rbd-pools are performed by using a object named "rbd_directory" which resides on the pool...
Querying this object with 142 entries need 0.024seconds.
# time rados -p RBD_XenStorage-07449252-bf96-4daa-b0a6-687b7f1c369c listomapvals rbd_directory

id_12da262ae8944a
value (14 bytes) :
00000000  0a 00 00 00 5f 5f 73 72  6c 6f 63 6b 5f 5f        |....__srlock__|
0000000e

id_12f2943d1b58ba
value (44 bytes) :
00000000  28 00 00 00 52 42 44 2d  31 62 34 32 31 38 39 31  |(...RBD-1b421891|
00000010  2d 34 34 31 63 2d 34 35  33 30 2d 62 64 66 33 2d  |-441c-4530-bdf3-|
00000020  61 64 32 62 31 31 34 61  36 33 66 63              |ad2b114a63fc|
0000002c
...

real    0m0.024s
user    0m0.023s
sys    0m0.000s
I also analyzed the state of the OSD holding this object:
- ceph osd map RBD_XenStorage-07449252-bf96-4daa-b0a6-687b7f1c369c rbd_directory
osdmap e7400 pool 'RBD_XenStorage-07449252-bf96-4daa-b0a6-687b7f1c369c' (14) object 'rbd_directory' -> pg 14.30a98c1c (14.1c) -> up ([36,0,38], p36) acting ([36,0,38], p36)
Repeating queries resulted in 3.6% cpu usage - the logs do not provide any useful information.
Analyzing this command by strace, suggests me that there is something wrong with the "rbd" command implementation.
# strace -f -c rbd ls -l --pool RBD_XenStorage-07449252-bf96-4daa-b0a6-687b7f1c369c > /dev/null
strace: Process 50286 attached
strace: Process 50287 attached
strace: Process 50288 attached
strace: Process 50289 attached
strace: Process 50290 attached
strace: Process 50291 attached
strace: Process 50292 attached
....
!!! 2086 threads !!!
....
% time     seconds  usecs/call     calls    errors syscall
------ ----------- ----------- --------- --------- ----------------
 98.42  219.207328        2020    108534     20241 futex
  1.47    3.265517         162     20099           epoll_wait
  0.06    0.131473           3     46377     22894 read
  0.02    0.053740           4     14627           sendmsg
  0.01    0.017225           2     10020           write
  0.00    0.008975           4      2001           munmap
  0.00    0.007260           3      2170           epoll_ctl
  0.00    0.007171           3      2088           madvise
  0.00    0.003139           1      4166           rt_sigprocmask
  0.00    0.002670           1      2086           prctl
  0.00    0.002494           1      3381           mprotect
  0.00    0.002315           1      2087           mmap
  0.00    0.002120           1      2087           set_robust_list
  0.00    0.002098           1      2084           gettid
  0.00    0.001833           1      2086           clone
  0.00    0.001152           8       136        87 connect
  0.00    0.000739           7       102           close
  0.00    0.000623          13        49           shutdown
  0.00    0.000622           6       110           fcntl
  0.00    0.000469          10        49           socket
  0.00    0.000466           6        73        29 open
  0.00    0.000456           9        49           setsockopt
  0.00    0.000166           6        27        27 access
  0.00    0.000164           4        37           fstat
  0.00    0.000070           4        17           brk
  0.00    0.000047           5        10         5 stat
  0.00    0.000013           4         3           pipe
  0.00    0.000012           4         3           epoll_create
  0.00    0.000010           1        11           rt_sigaction
  0.00    0.000007           7         1           lseek
  0.00    0.000007           7         1           execve
  0.00    0.000006           2         3           uname
  0.00    0.000005           3         2           sysinfo
  0.00    0.000005           5         1           arch_prctl
  0.00    0.000005           5         1           membarrier
  0.00    0.000003           3         1         1 ioctl
  0.00    0.000003           3         1           getrlimit
  0.00    0.000003           3         1           set_tid_address
  0.00    0.000000           0         1           getuid
------ ----------- ----------- --------- --------- ----------------
100.00  222.720411                224582     43284 total
Our System:
- Luminous/12.2.5
- Ubuntu 16.04
- 5 OSD Nodes (24*8 TB HDD OSDs, 48*1TB SSD OSDS, Bluestore, 6Gb Cache Size per OSD, 192GB RAM, 56 HT CPUs)
- 3 Mons (64 GB RAM, 200GB SSD, 4 visible CPUs)
- 2 * 10 GBIT, SFP+, bonded xmit_hash_policy layer3+4
- the cluster is currently in preproduction state, there is no significant load
Files