Final report
by Veronica Estrada Galinanes (koleosfuscus)
My webpage: http://members.unine.ch/veronica.estrada/index.html
- Table of contents
- Final report
Summary
The goal of this work is to facilitate the design and operation of a storage cluster by modelling the impact that different replication schemes have on the durability of the stored content. The model is based on Ceph but can be applied on any other object-based storage system. Ceph is a flexible platform to construct a cluster from different “storage bricks”. The software used for this report is available online and open-source. We provide an outline analysis of system reliability and release the Markov model used for the case of the irregular fault-tolerance codes that are being implemented in Ceph.
This project was done in the context of Google Summer of Code 2014. Ceph is participating as a mentoring organization for the first time. Link
The mentors of this projects are: Kyle Bader and Loic Dachary
Background
In order to estimate durability, we need to calculate the system reliability. Note that durability differs from availability. Availability is the probability that an object is accesible at any point of time. Durability is the probability that the object is not permanently lost after a failure. While a simple formula for the latter is the ratio between the uptime and the total life time of the system, the former is usually estimated with Markov Models.
The reliability of a system is a first indication of trustworthiness. Redundancy is the standard approach to increase the reliability of a storage system. The major mechanisms are the traditional RAID in its different configurations, replication, MDS and non-MDS erasure codes.
MDS is an acronym for maximum distance separable codes. In the context of storage systems, codes are denoted by (k, m)-MDS where m=n-k is the number of arbitrary failures that the code can tolerate. Fault tolerance is characterized by this distance, m + 1 (the numbers of erasures that cause data loss). Codes that don't belong to this category, non-MDS codes, can tolerate more than m failures but this "extra" failures are not arbitrary.
Ceph in a nutshell
Ceph is a distributed storage system designed for high-throughput and low latency at a petabyte scale. The Ceph object store, also known as RADOS, is the intelligence inherent in the Ceph building blocks used to construct a storage cluster. We focus our analysis on a cluster constructed from object storage devices (OSDs). The Crush algorithm calculates where the object lives.
RADOS
It is the default storage mechanism to distribute objects across a Ceph cluster. Objects are stored in replicated- or in erasure-coded-pools.
A pool contains pg_num placement groups (PG) that are specified at the moment of pool creation. The number of PG increases as the cluster scale to offer a better load-balance. Each PG has a different level of replication.
Erasured pool
Each object inside an erasure coded pool is represented by k data chunks and m coding chunks. The pool uses k+m OSDs and supports the lost of m of them.
Erasure codes save a substancial amount of storage space while providing high resilience. The storage savings are paid with higher bandwidth requirements. Reading and writing content require to establish more network connections. Besides, in a faulty scenario, repairing one missing block requires to read and write multiple blocks.
A typical use of an erasured pool is in cold storage or as part of hybrid solutions to reduce the price of storage. For more information on this project see http://ceph.com/docs/firefly/dev/erasure-coded-pool/.
Replicated pool
Replication is most widely accepted for cases where high throughput is a requirement. Replication can be seen as a special case of erasures where m=1.
Locally Repairable Codes
The bandwidth overhead introduced by erasure codes is a problem in geographically dispersed data centers. The time to do repair an object has impact on the durability of the object. One of the most attractive reasons to implement LRC is to reduce repair time and consequently to increase both availability and durability of the objects.
The implementation of LRC in Ceph is strongly based on Xorbas (Sathiamoorthy, Asteris, Papailiopoulos, Dimakis, Vadali, Chen, & Borthakur, 2013). In such code non-MDS and MDS codes are combined. Details on the project are updated here?
Reliability estimation
Reliability R(t) is an standard measurement of the dependability of a system. There are many ways to estimate the reliability of the system. Unfortunately, using two different methods to compare and validate results is not straightforward. The variety of assumptions taken by different tool designers generate meaningless results. This problematic has been previously documented (Schroeder and Gibson, 2007; Greenan, Plank & Wylie, 2010).
The analysis of system reliability is commonly done with Markov models. Obtaining meaningful metrics for real-world applications is a challenge. Outside of the controlled environment of a simulation, there are many components and subcomponents that can fail. How this failures occur and how they are repaired determines the system's status. Thought, the number of considered states should be kept at minimum to keep the problem tractable. There is a tradeoff between the tractability and the meaningfulness of the model. Another relevant problem is knowing the failure distribution. Often model designers assume for the sake of simplicity that failures appear at a constant rate, i.e. a Poisson distribution. Though, failures don't follow a Poisson distribution. Schroeder (2007) as well as other authors recommend Weibull or Gamma Distribution.
Combinatorial analysis
A very simple but useful method is combinatorial analysis (Shooman, 2002). It is the first step to compare and understand the reliability offered by different redundant methods, or by the same method with different parameters. In this analysis, we can skip Markov models and rigorous failure models. We analyze the redundant components of the system, in our case the replicas or blocks in a stripe, with concepts of probability and reliability block diagrams. Such schema represents the number of paths that connect cause and effect. In our case, cause is to request an object and the effect is the answer that we obtain from the ceph storage. If we get the get the object, the system successes and if we cannot get the object, the system fails. The basic block diagrams represent a serial and parallel configuration.
Block placement has an important effect on the object durability. To maintain the redundancy, every block in Ceph must be mapped to different OSDs. This is achieved with the Crush algorithm. We simply assume that each OSD fails independently. This assumption permits skipping the burden of conditional probabilities. The expansion of union terms is simplified to term additions and the intersection terms into products.
The probability of a block to be alive is P(xi). For further clarity, we assume that after x hours of operation each block has P(xi) = p and probabilty of failure q = 1 - p.
Serial configuration
Serial connections require that all blocks are alive. There is only one path to connect cause and effect. The reliability of a series chain is always smaller than the smallest reliability in the chain.
R(t) = P(x1, x2, ...,xn) = P(x1)P(x2)...P(xn) = pn
Parallel configuration
Parallel connections has multiple paths between input to output. If at least one of the paths doesn't fail, the object will be read. Parallel configuration is easier to calculate by using the probability of failures.
R(t) = P(x1 + x2 + ... + xn) = 1 - (1 - p)(1 - p)...(1 - p) = 1 - qn
The parallel configuration represents the classical replication mode.
r-out-of-n configuration
This useful model is applied to analyze MDS erasure codes. In a (k, m) Reed-Solomon code, any k blocks are need to read the object, in other words the code tolerates m failures. When the components are independent, the formula to calculate reliability is derived from a binomial distribution.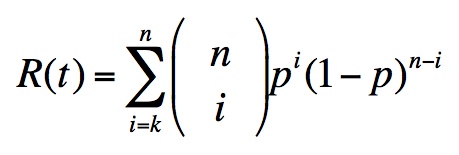
Now, we can roughly estimate the reliability for various redundancy configurations and various probabilities. To construct a reference table, we choose common configurations for RS. In particular (3,6) RS has the same 2x storage overhead than the popular triple-replication option. (6,3) RS is the code used in the study for erasure codes in Windows Azure platform at Microsoft. (10,4) RS is the code used by Sathiamoorthy? (2013) in Xorbas at Facebook.
Reference Table - Reliability values for various configurations| 1 | 2 | 3 | 4 | 5 | 6 | |
| p, q | 3-replication | 4-replication | 5-replication | (3,6) RS | (6,3) RS | (10,4) RS |
| 0.95, 0.05 | 3 nines | 5 nines | 6 nines | 7 nines | 3 nines | 3 nines |
| 0.98, 0.02 | 5 nines | 6 nines | 8 nines | 10 nines | 4 nines | 5 nines |
| 0.99, 0.01 | 6 nines | 8 nines | 10 nines | 12 nines | 5 nines | 6 nines |
Tools
Ceph reliability modelSource and documentation
The tool models disk, some RAID configurations, rados (replicated pool) and also considers a multi-site environment.
The metrics available are listed below:
- probability of object survival (per 1 years)
- probability of loss due to site failures (per 1 years)
- probability of loss due to drive failures (per 1 years)
- probability of loss due to NREs during recovery (per 1 years)
- probability of loss due to replication failure (per 1 years)
- expected data loss per Petabyte (per 1 years)
It was developed by other programmer sometime ago and it doesn't contain support to the new erasure codes supported by Ceph.
High-Fidelity Reliability Simulator (HFRS)
Source
For detailed documentation see Greenan thesis
Kevin Greenan defend his PhD thesis titled "Reliability and Efficiency in Erasure-Coded Storage Systems" in 2009. HFRS (Greenan and Wylie, 2008?), is evaluated in Greenan's thesis. The tool is developed in Python and is open source.
This tool is a Monte Carlo simulator that accepts failures/repair distributions for the analysis of linear erasure codes and sector failures. The tool can simulate rare events, an event that will most likely remain unobserved during the period of a standard simulation. This feature is necessary when the simulated system is highly fault-tolerant.
The metrics provided by HFRS are listed below:- system unreliability
- mean time to data loss (MTTDL)
The tool provides some models for MDS codes, Weaver codes, flat codes and simple product codes. To model irregular fault-tolerance codes the simulator expects as an input the fault tolerance of the code expressed in a fault tolerance vector (FTV) or a fault tolerance matrix (FTM).
Reliability for LRC codes in HFRS
We develop a Markov model for (10,6,5) LRC to include the effect of the local repairs in the system reliability. The transition rates from left to right represent disk failures. Each state is identified with the number of remaining blocks, e.g. the first state without failures has 10+6 blocks. There are two possible states after the fourth failure: the code could be repairable or not. The transition is decided according the failure pattern that the code tolerates.
pd1 and pd2 are "decodability ratios", i.e. the likelihood that the code tolerates a 5th and a 6th failure, respectively. The values are obtained through a brute force enumeration of the failure patterns. In this model, we use pd1=0.88 and pd2=0.82.
Figure 1 - Markov model for (10,6,5) LRC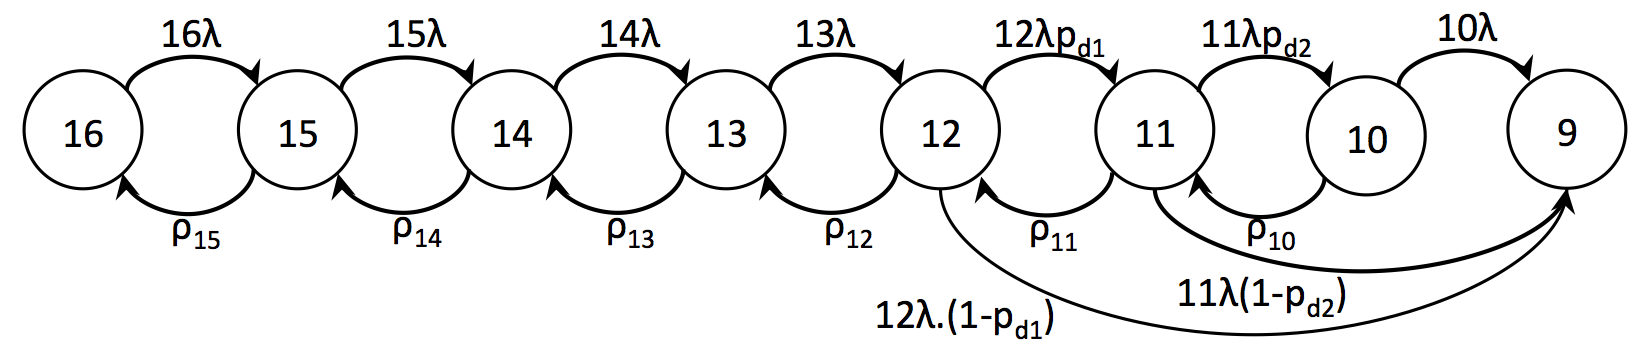
The description of the model (needed as HFRS input) can be found "here":ceph_10_6_5.disk.model
Results of the simulator:
Analytic MTTDL: 1.1576683533e+15
Analytic prob. of failure: 7.56663e-11
Conclusion
The results presented here are an outline of the methodology to analyze system reliability and to understand the durability of an object when different redundancy methods are implemented.
We suggest future work on the automatization of failure pattern generators for irregular fault-tolerant codes like LRC. Brute-force analysis (as we did in this work) is still an alternative for small codes like (10,6,5) LRC.
Acknowledgements
The author would like to thank Kevin Greenan and Jay Wylie and the mentors of this project for their feedback.
References
Greenan, K., & Wylie, J. J. (2008) High-fidelity reliability simulation of XOR-based erasure codes (Poster submission/Extended abstract). In FAST
Greenan, K. M., Plank, J. S., & Wylie, J. J. (2010, June). Mean time to meaningless: MTTDL, Markov models, and storage system reliability. InProceedings of the 2nd USENIX conference on Hot topics in storage and file systems (pp. 5-5). USENIX Association.
Huang, C., Simitci, H., Xu, Y., Ogus, A., Calder, B., Gopalan, P., ... & Yekhanin, S. (2012, June). Erasure Coding in Windows Azure Storage. In USENIX Annual Technical Conference (pp. 15-26).
Sathiamoorthy, M., Asteris, M., Papailiopoulos, D., Dimakis, A. G., Vadali, R., Chen, S., & Borthakur, D. (2013, March). XORing elephants: Novel erasure codes for big data. In Proceedings of the VLDB Endowment (Vol. 6, No. 5, pp. 325-336). VLDB Endowment.
Schroeder, B., & Gibson, G. A. (2007, February). Disk failures in the real world: What does an MTTF of 1, 000, 000 hours mean to you?. In FAST (Vol. 7, pp. 1-16).
Shooman, M. (2002) Reliability of Computer Systems and Networks: Fault Tolerance,Analysis,and Design. Book. Ed. John Wiley & Sons Inc., New York, NY, USA? , ISBN 0471293423?
Updated by Jessica Mack almost 9 years ago · 2 revisions