Bug #61824
openmgr/prometheus: Prometheus metrics type counter decreasing
0%
Description
We've added a few osd nodes to the cluster, when finished backfills we've noticed abnormal metrics. The type of metrics are counters but values are decreasing
The affected metrics are:
ceph_pool_rd
ceph_pool_rd_bytes
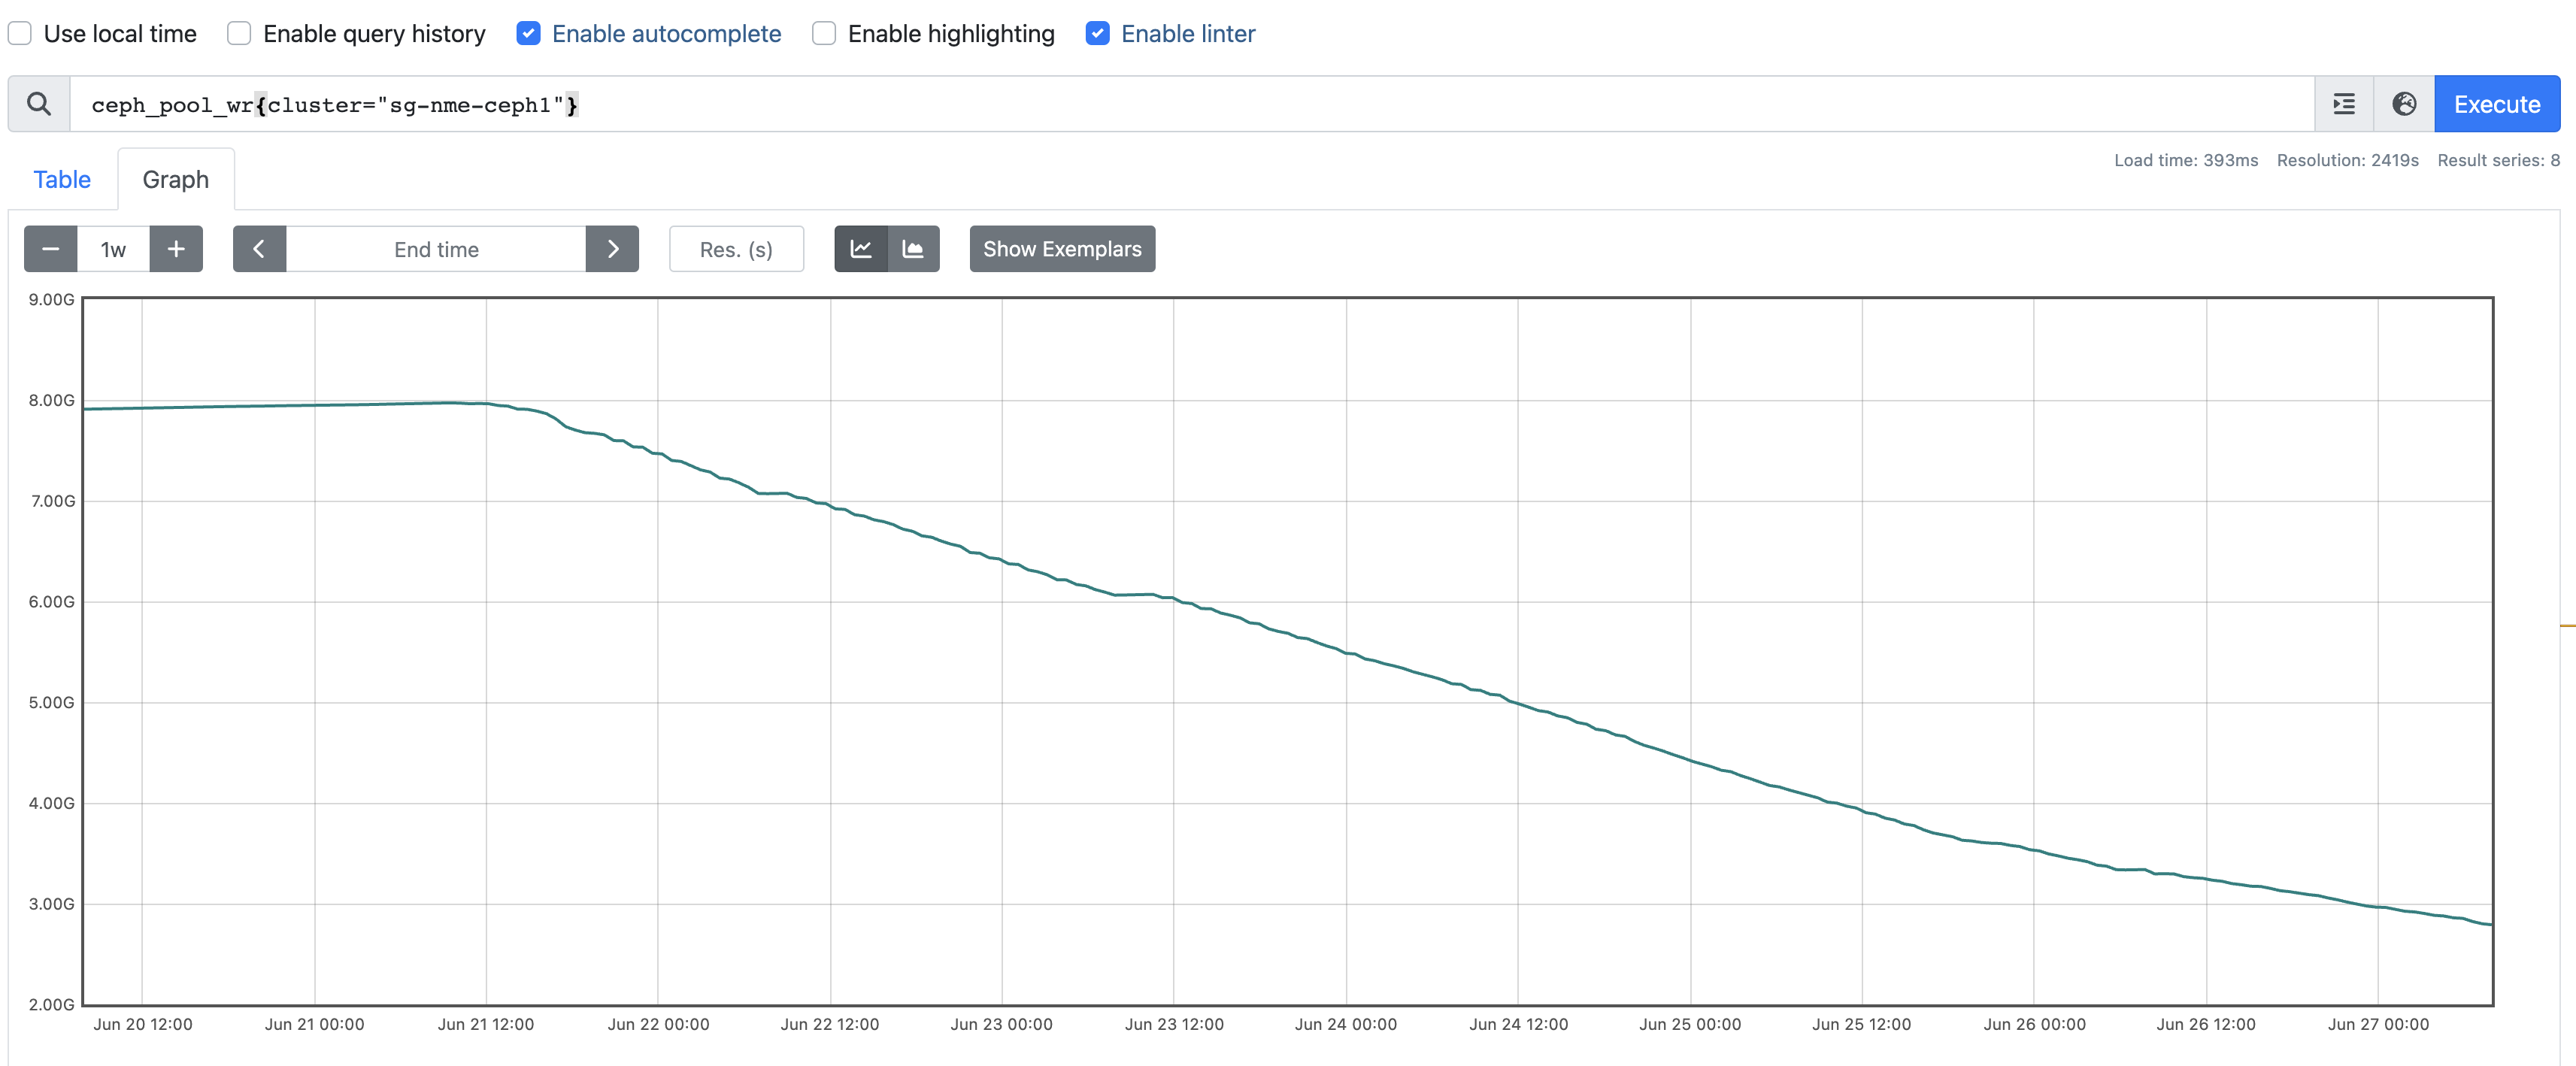
ceph_pool_wr
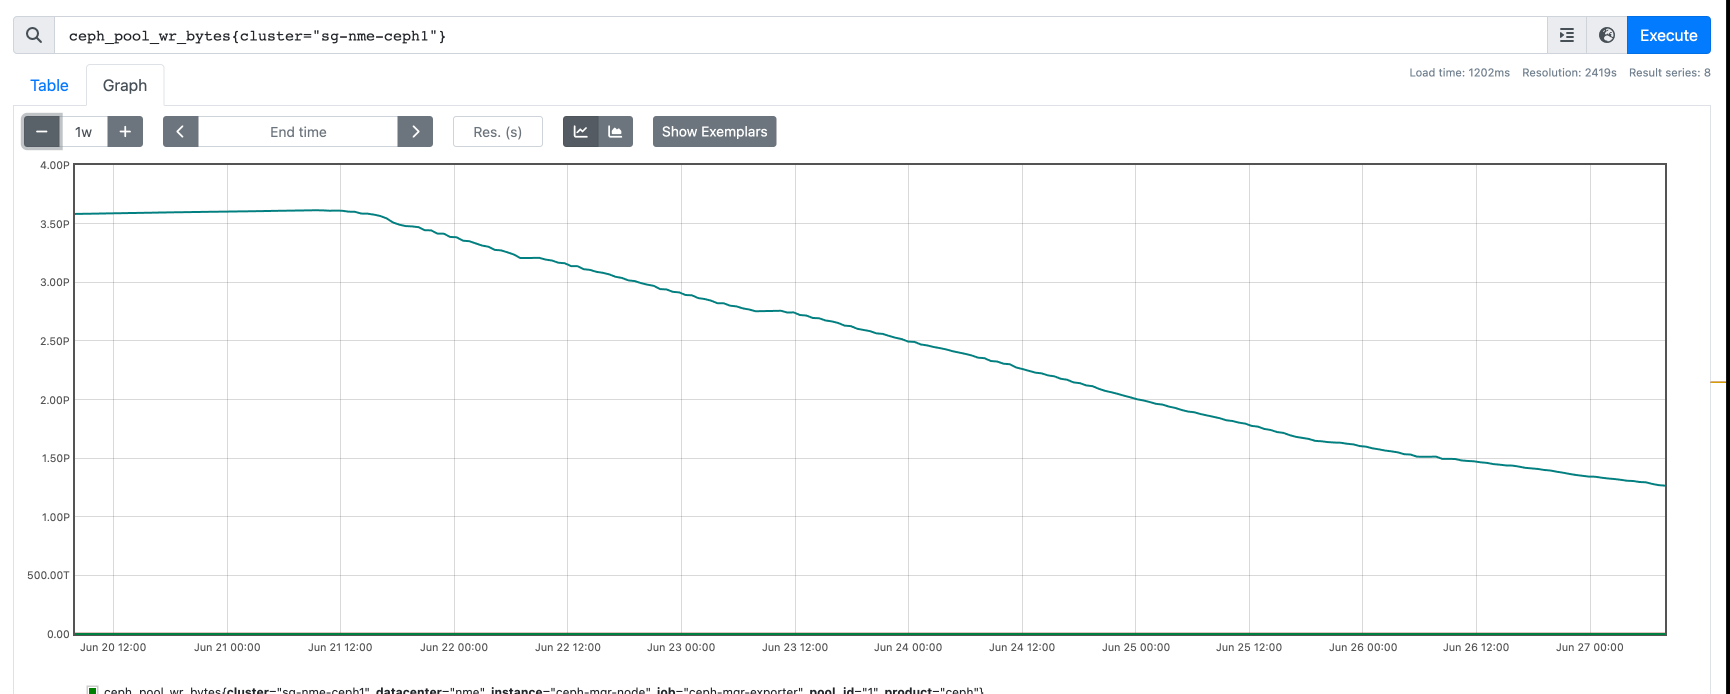
ceph_pool_wr_bytes
Files
Updated by Jonas Nemeikšis 10 months ago
Seems like rados df wrong provides WR_OPS, WR_OPS:
[root@mon1 ~]# rados df -p default.rgw.buckets.data
POOL_NAME                      USED    OBJECTS  CLONES      COPIES  MISSING_ON_PRIMARY  UNFOUND  DEGRADED       RD_OPS       RD      WR_OPS       WR  USED COMPR  UNDER COMPR
default.rgw.buckets.data    1.0 PiB  221738020       0  1108690100                   0        0         0   3766935322   79 TiB  2722274766  1.1 PiB         0 B          0 B
After some minutes WR_OPS decreased
[root@mon1 ~]# rados df -p default.rgw.buckets.data
POOL_NAME                      USED    OBJECTS  CLONES      COPIES  MISSING_ON_PRIMARY  UNFOUND  DEGRADED       RD_OPS       RD      WR_OPS       WR  USED COMPR  UNDER COMPR
default.rgw.buckets.data    1.0 PiB  221571530       0  1107857650                   0        0         0   3763107878   79 TiB  2714576718  1.1 PiB         0 B          0 B
Is it a known bug?
Updated by Radoslaw Zarzynski 10 months ago
- Project changed from mgr to RADOS
- Category deleted (
prometheus module)
Looks like a RADOS bug. Reassigning.
Updated by Radoslaw Zarzynski 9 months ago
- Status changed from New to Need More Info
I was looking for num_rd_kb in the OSD code. It looks to me it almost never goes down but there is the logic in split:
  void split(std::vector<object_stat_sum_t> &out) const {
#define SPLIT(PARAM)                            \
    for (unsigned i = 0; i < out.size(); ++i) { \
      out[i].PARAM = PARAM / out.size();        \
      if (i < (PARAM % out.size())) {           \
        out[i].PARAM++;                         \
      }                                         \
    }
#define SPLIT_PRESERVE_NONZERO(PARAM)           \
    for (unsigned i = 0; i < out.size(); ++i) { \
      if (PARAM)                                \
        out[i].PARAM = 1 + PARAM / out.size();  \
      else                                      \
        out[i].PARAM = 0;                       \
    }
Do you have the autoscaler turned on? Do the freshly added OSDs map into the affected pool? Is the issue reproducible?
Updated by Jonas Nemeikšis 9 months ago
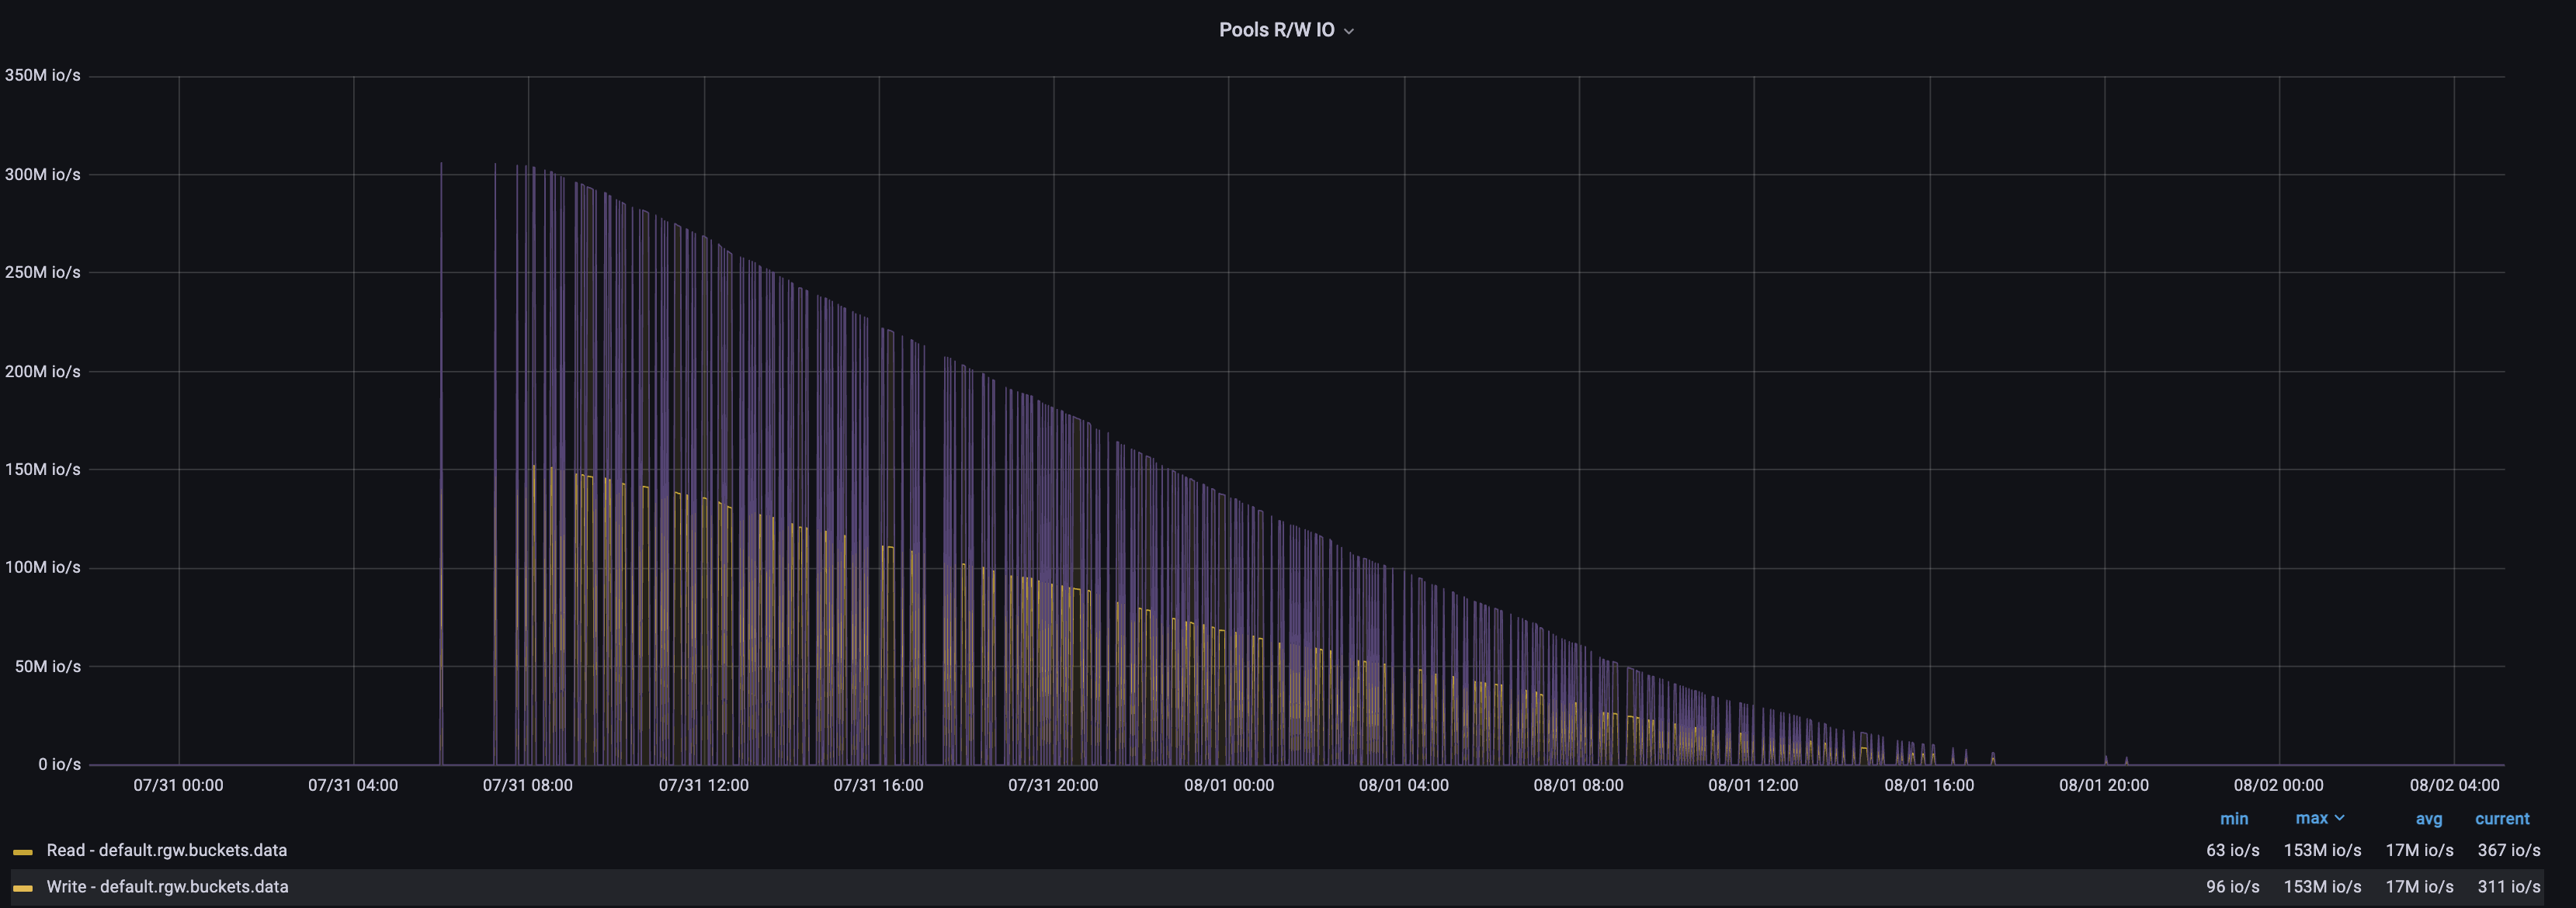
- File Screenshot 2023-07-31 at 21.52.33.png Screenshot 2023-07-31 at 21.52.33.png added
- File Screenshot 2023-07-31 at 21.54.21.png Screenshot 2023-07-31 at 21.54.21.png added
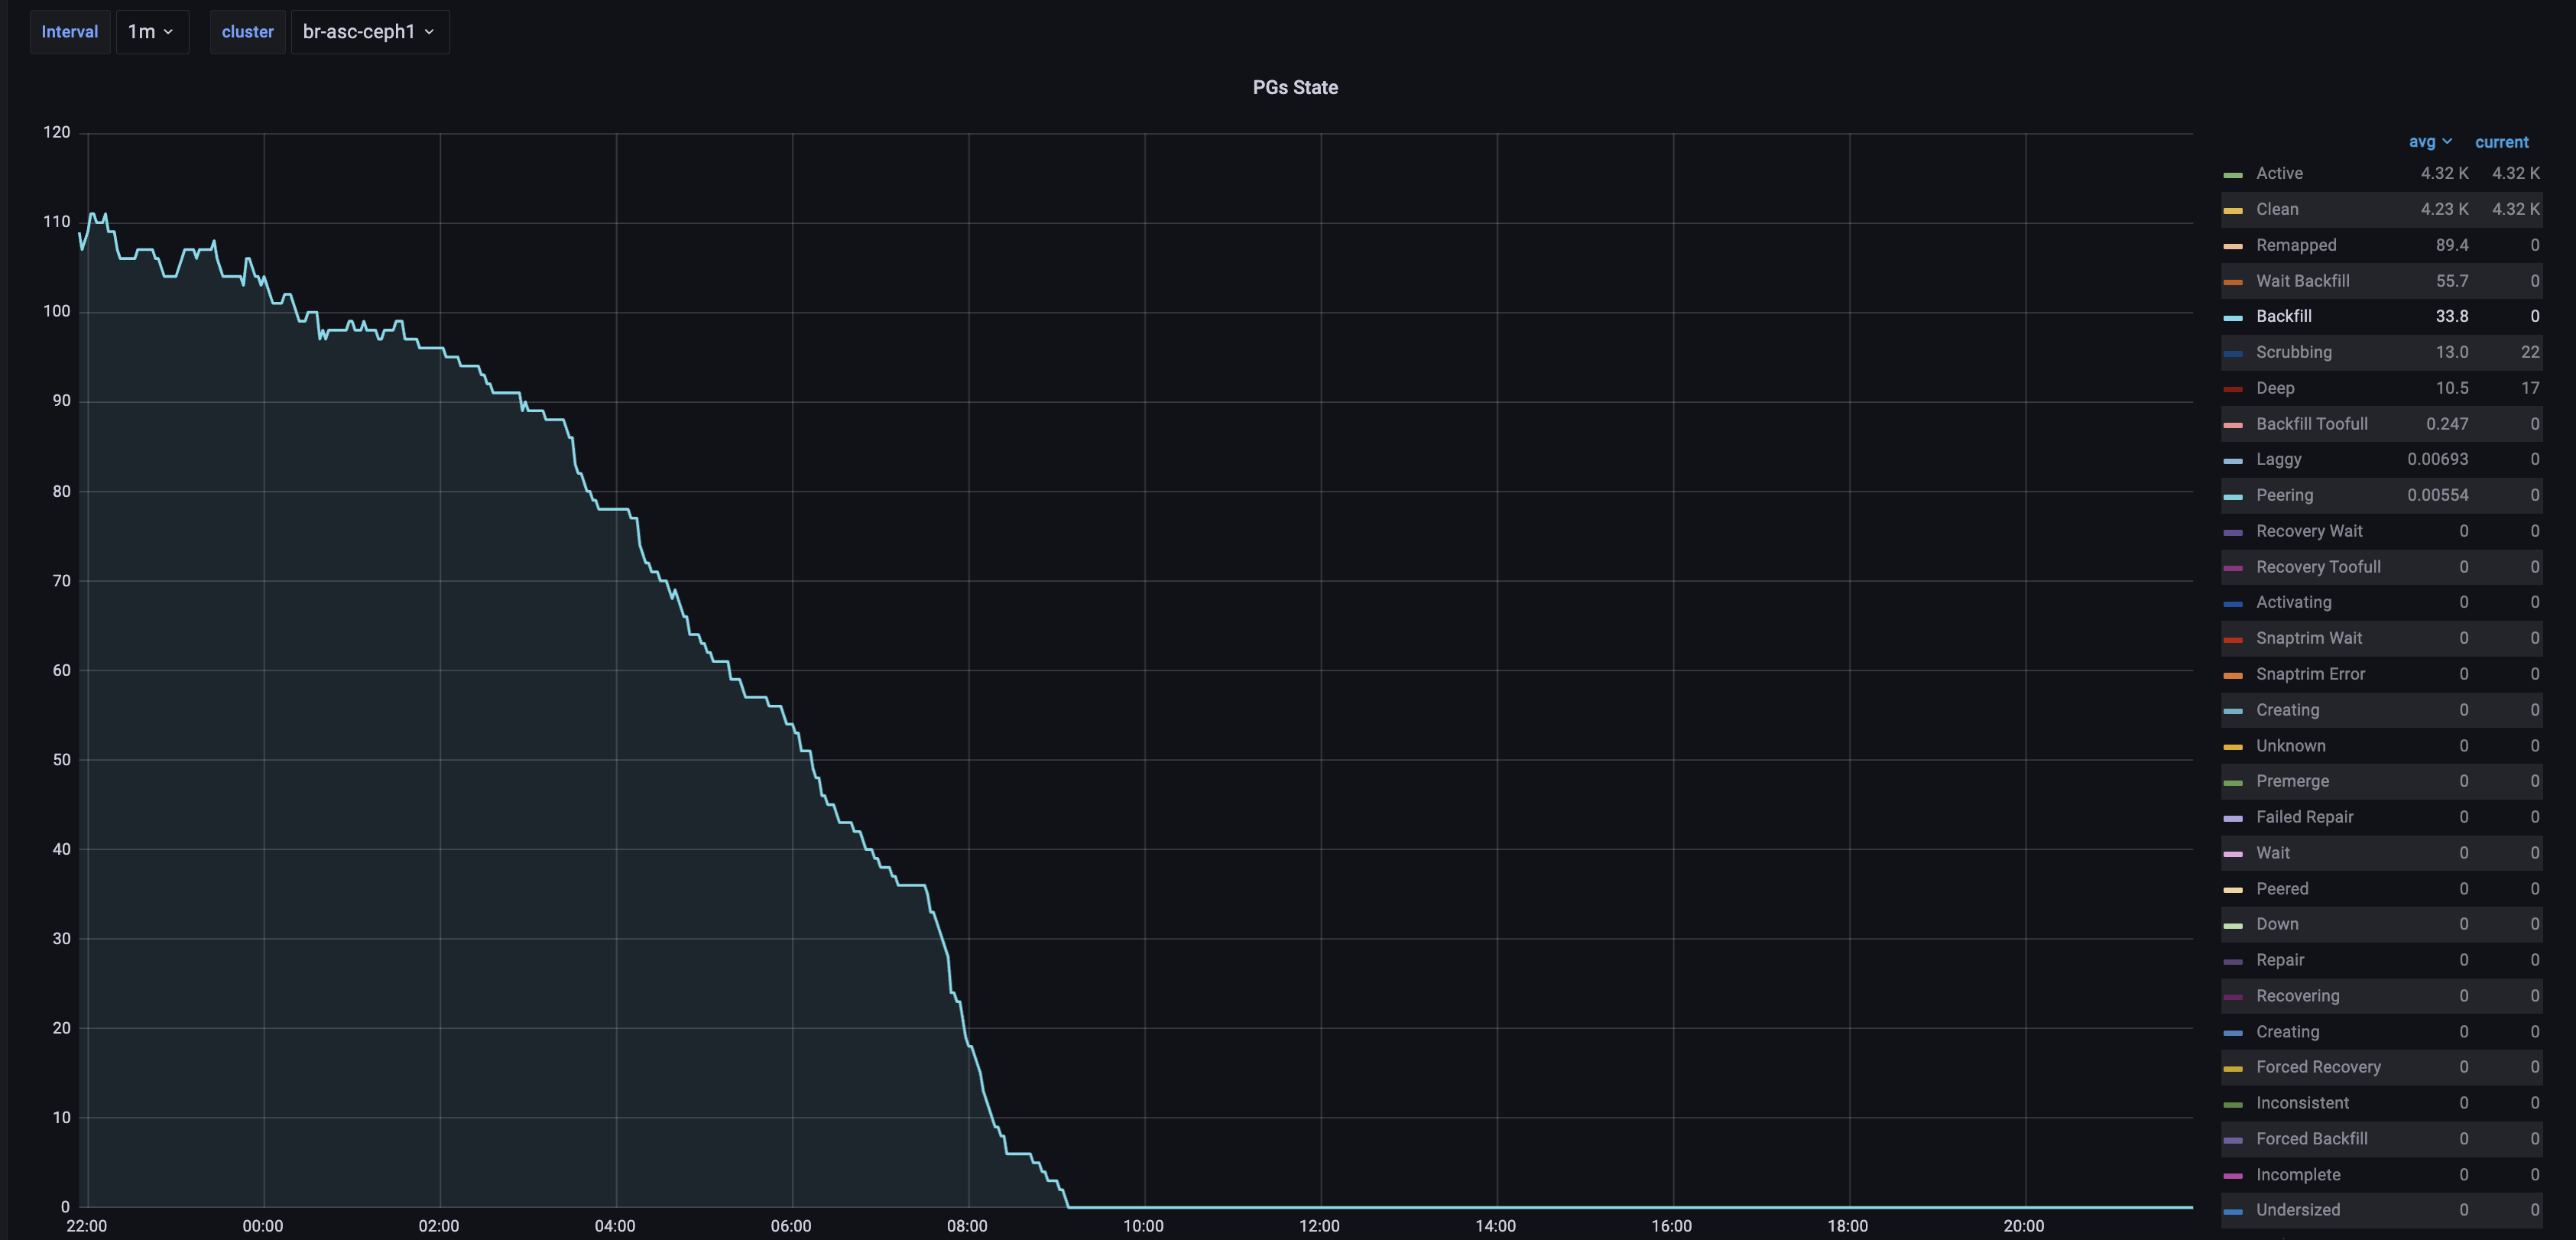
We've turned off the autoscaler in all clusters. Yes, freshly added OSDs map into the affected pool. Maybe it is related that we've added OSDs and then increased pg_num on pool?
The issue seems reproducible when increasing pg_num. For now, one cluster backfilling without increased pg_num. I will come back with information after backfills.
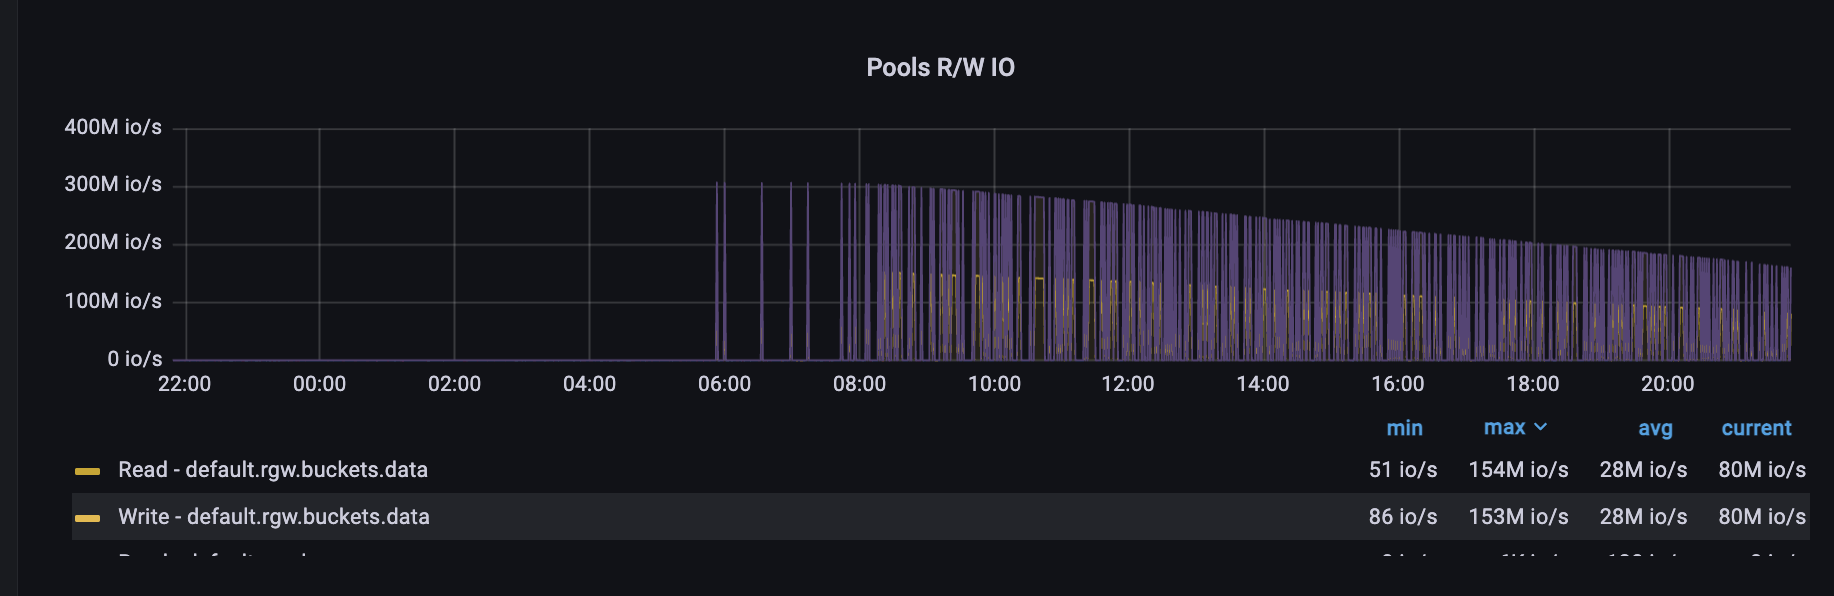
I've added screenshots, backfills done and metrics then wrong, but after some days metrics back to normal(decreasing value little by little)
Updated by Jonas Nemeikšis 9 months ago
Yes, I can confirm that metrics went wrong only in this scenario:
1. Added new osds nodes to pool
2. Increased pg_num
3, Done backfills
4. Wrong metrics ~2 days (attached screenshot)
It is not a critical, but why two days metrics abnormal?