Bug #58530
openPacific: Significant write amplification as compared to Nautilus
0%
Description
After upgrading multiple RBD clusters from 14.2.18 to 16.2.9, we've found that OSDs write significantly more to the underlying disks per client write, on average, under Pacific than Nautilus. This is a 3x replicated configuration.
To show this, we can calculate, across the cluster, the average number of disk I/Os issued for each client write issued to the cluster: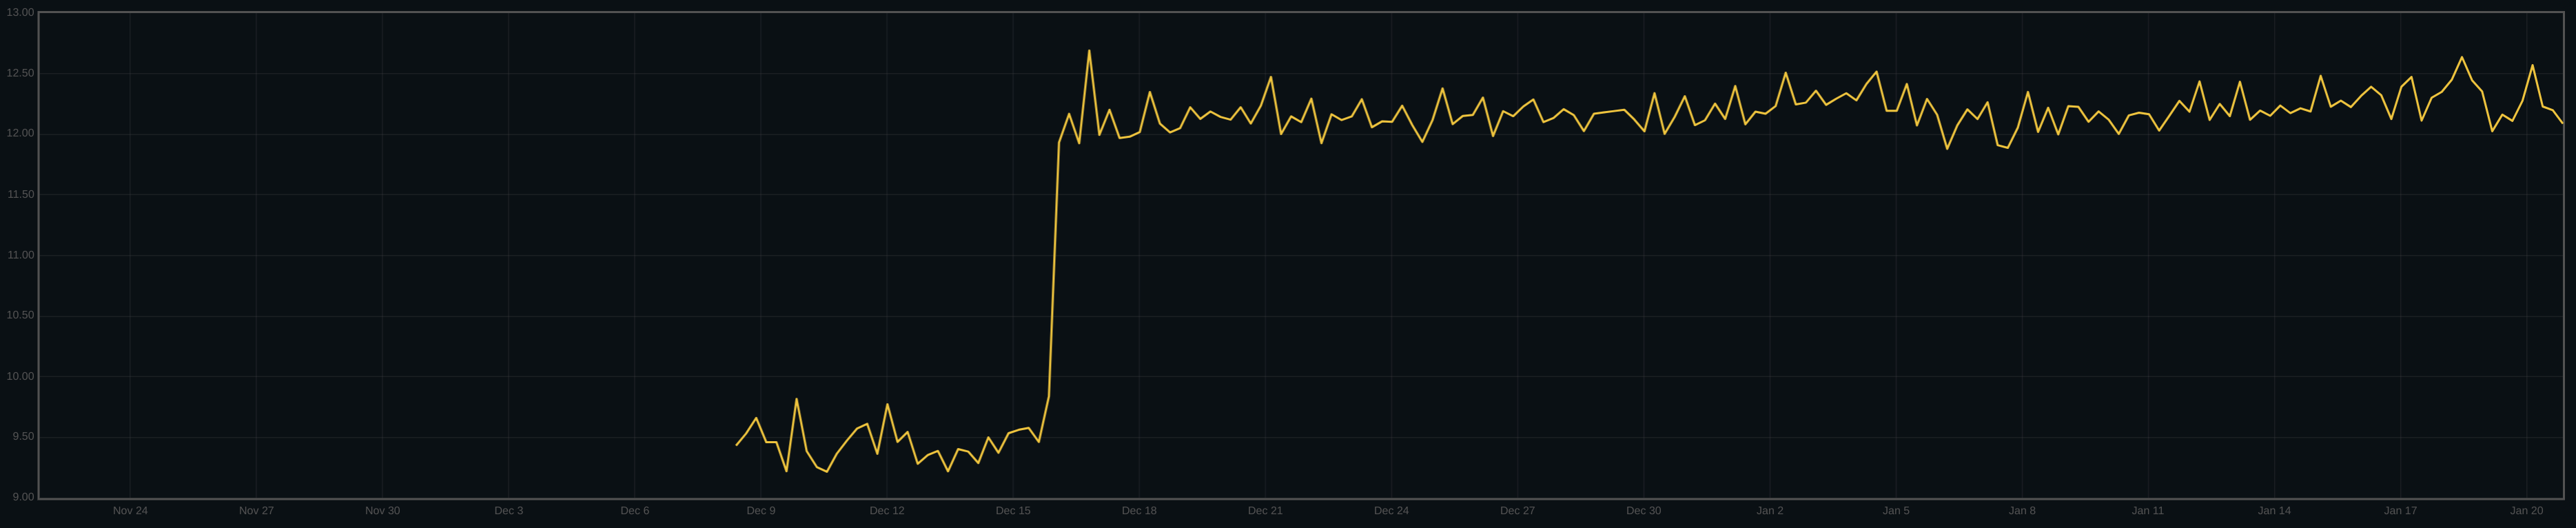
A similar effect can be seen in disk bytes written per client byte written to the cluster: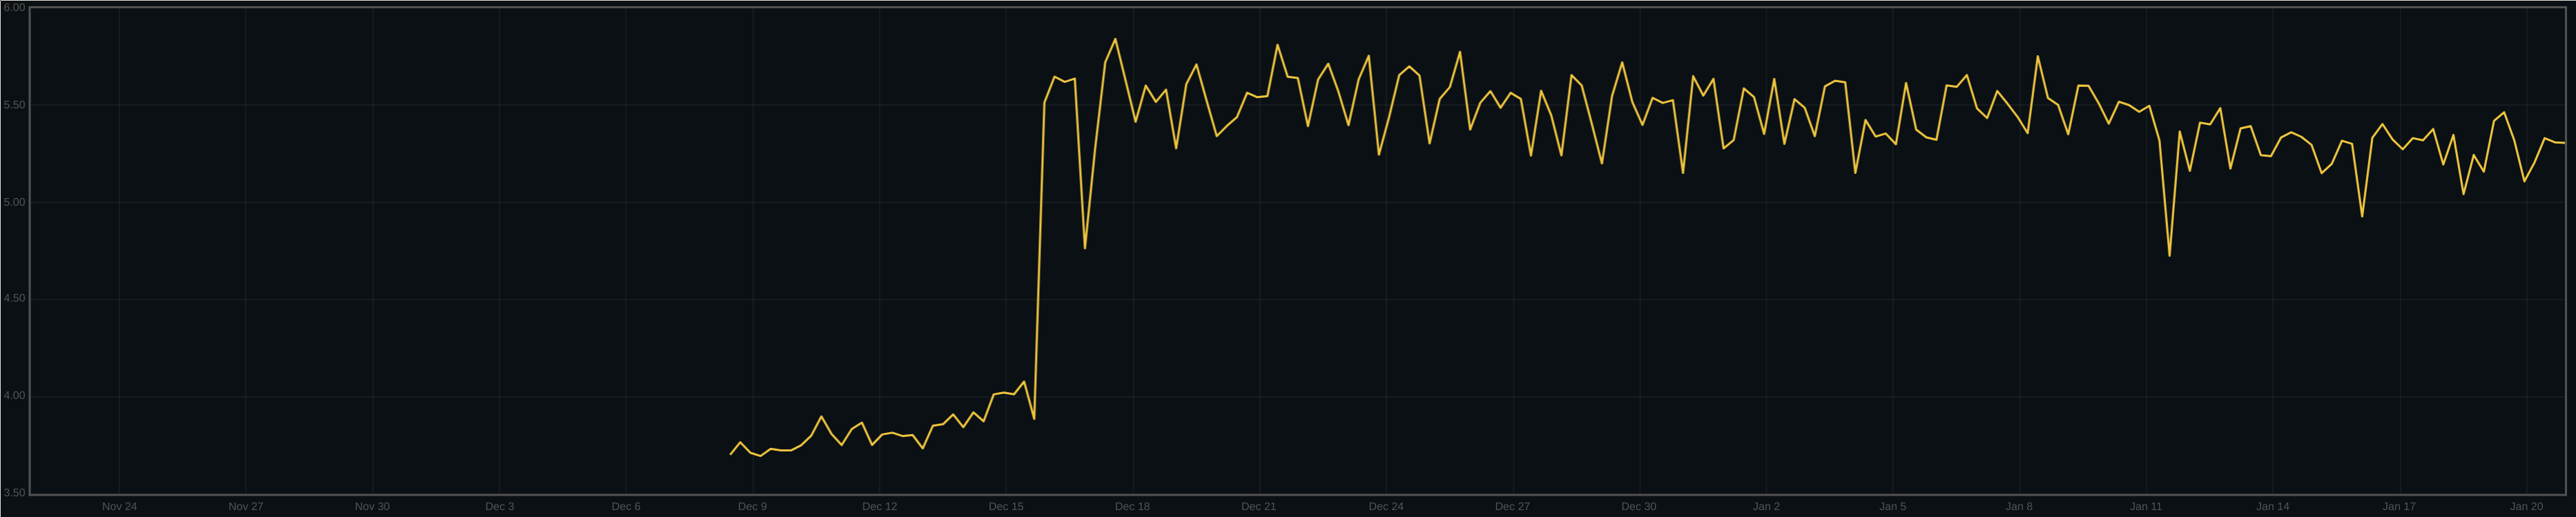
One can see the point where the cluster was upgraded, just after the 15th.
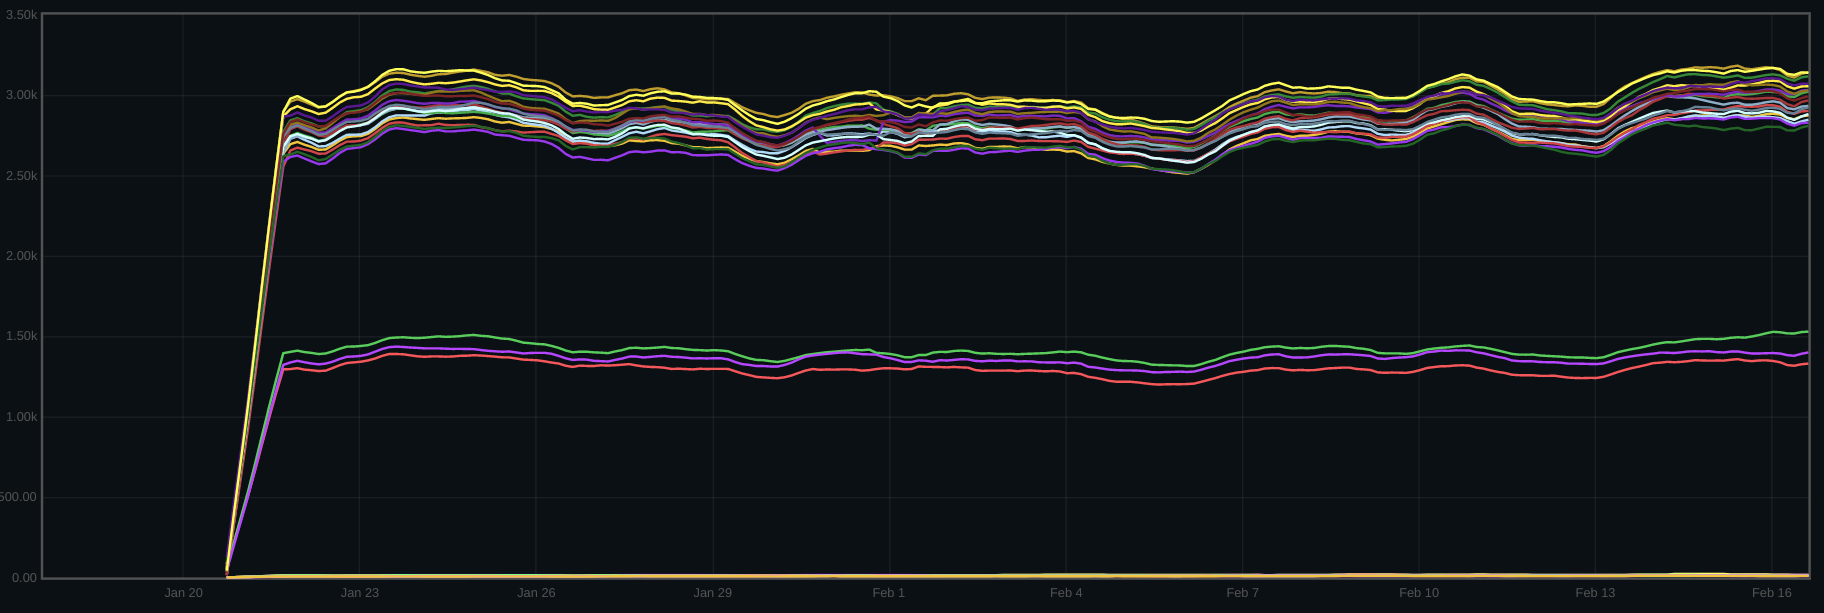
Here's the average disk I/O size on a per-host basis: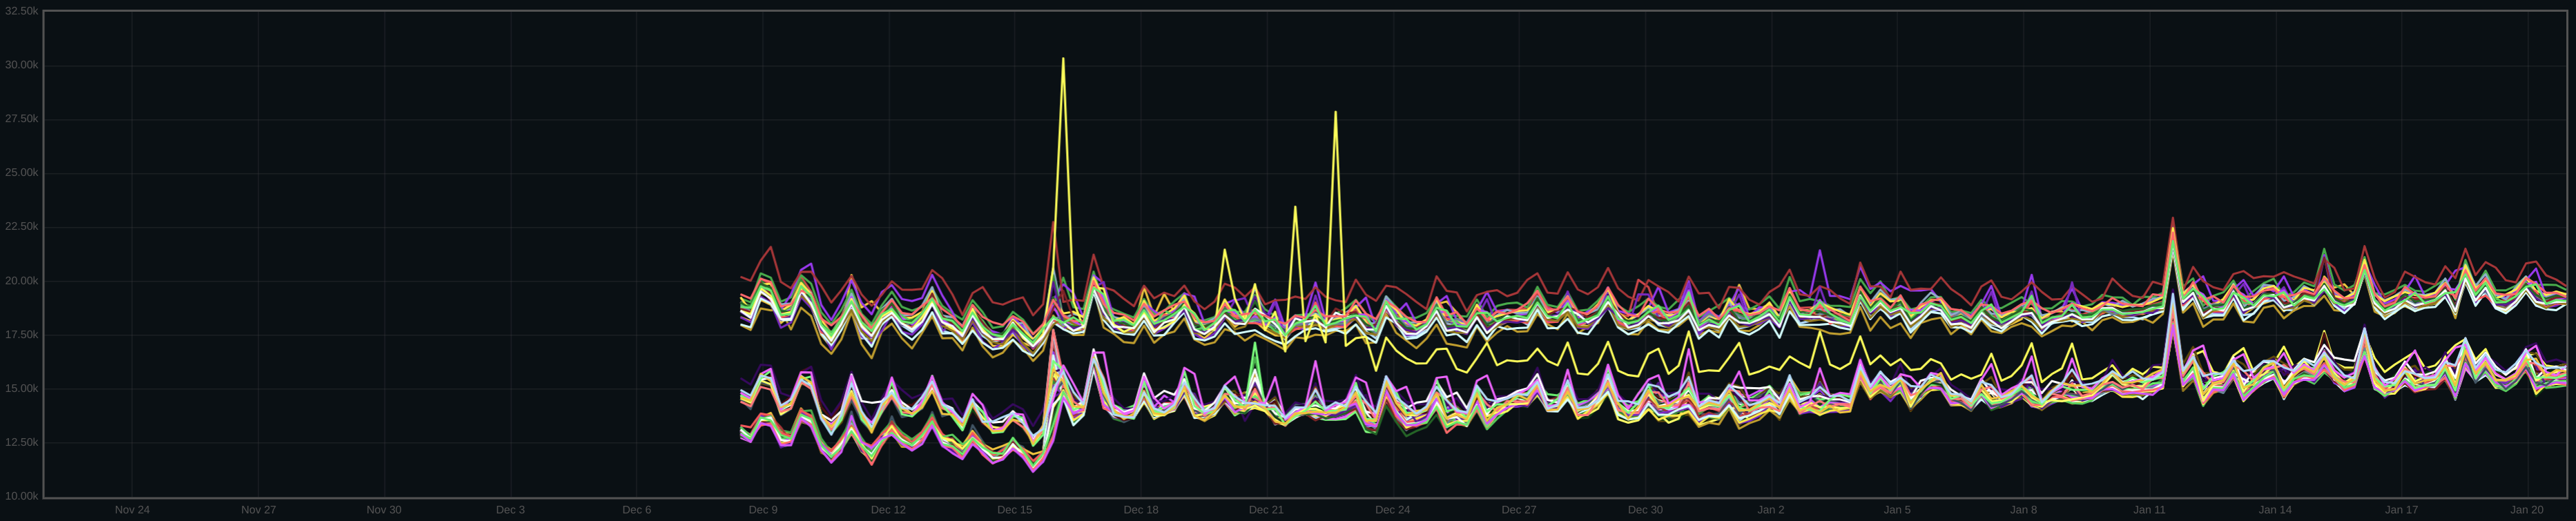
The hosts in the bottom cluster are 4k MAS, whereas the top cluster are 16k MAS. To my eyes, there was an increase in disk I/O size for both 16k and 4k MAS hosts, but the increase was larger for 4k MAS disks. The one yellow line that migrates from the top group to the bottom was a recreation of a number of the OSDs on that host, thus moving from 16k to 4k MAS. We don't have deferred write stats over the period, unfortunately.
At a high level, this doesn't seem to have a major performance impact. We've mostly seen this show up as a small increase in median latency for some clusters, but most customers see a latency improvement over Nautilus (avg, p50, p99). We did have to make some adjustments to older hardware to handle the increased write load. We are concerned that as we move on to even older hardware that this will result in a larger issue.
The other concern that we have is that this increases wear on SSD drives, since more is being written to the drive than before.
We do continue to investigate this issue, though we've hit a wall several times in what further information we can gather or which avenues to explore. We'll try to keep this ticket up to date with any further findings on our side.
Files
Updated by Igor Fedotov about 1 year ago
Joshua, please share perf counter dumps for a couple of OSDs of each MAS.
Updated by Joshua Baergen about 1 year ago
- File osd.683-perf-dump-2023-01-23T14_59_44+00_00 osd.683-perf-dump-2023-01-23T14_59_44+00_00 added
- File osd.300-perf-dump-2023-01-23T14_59_41+00_00 osd.300-perf-dump-2023-01-23T14_59_41+00_00 added
- File osd.42-perf-dump-2023-01-23T14_57_02+00_00 osd.42-perf-dump-2023-01-23T14_57_02+00_00 added
- File osd.683-perf-dump-2023-01-20T21_14_57+00_00 osd.683-perf-dump-2023-01-20T21_14_57+00_00 added
- File osd.300-perf-dump-2023-01-20T21_13_58+00_00 osd.300-perf-dump-2023-01-20T21_13_58+00_00 added
- File osd.42-perf-dump-2023-01-20T21_12_59+00_00 osd.42-perf-dump-2023-01-20T21_12_59+00_00 added
Hey Igor, it just so happens that we've collected some perf dumps from a cluster that we upgraded this weekend. We have perf dumps from Nautilus and Pacific for three OSDs: 42 (MAS=16K), 300 (MAS=4K), and 683 (MAS=4K). The Nautilus dumps are from the 20th and the Pacific dumps are from the 23rd. These were collected by resetting perf stats, sleeping 5 seconds, and then collecting the perf dump.
Let us know if we can provide any more information!
Updated by Joshua Baergen about 1 year ago
- File logged-bytes-two-clusters.png logged-bytes-two-clusters.png added
- File log-compactions-two-clusters.png log-compactions-two-clusters.png added
Hey Igor, based on the discussion at the perf meeting yesterday we've added some exports for bluefs log stats. Here's log compactions per second across the upgrade of two clusters: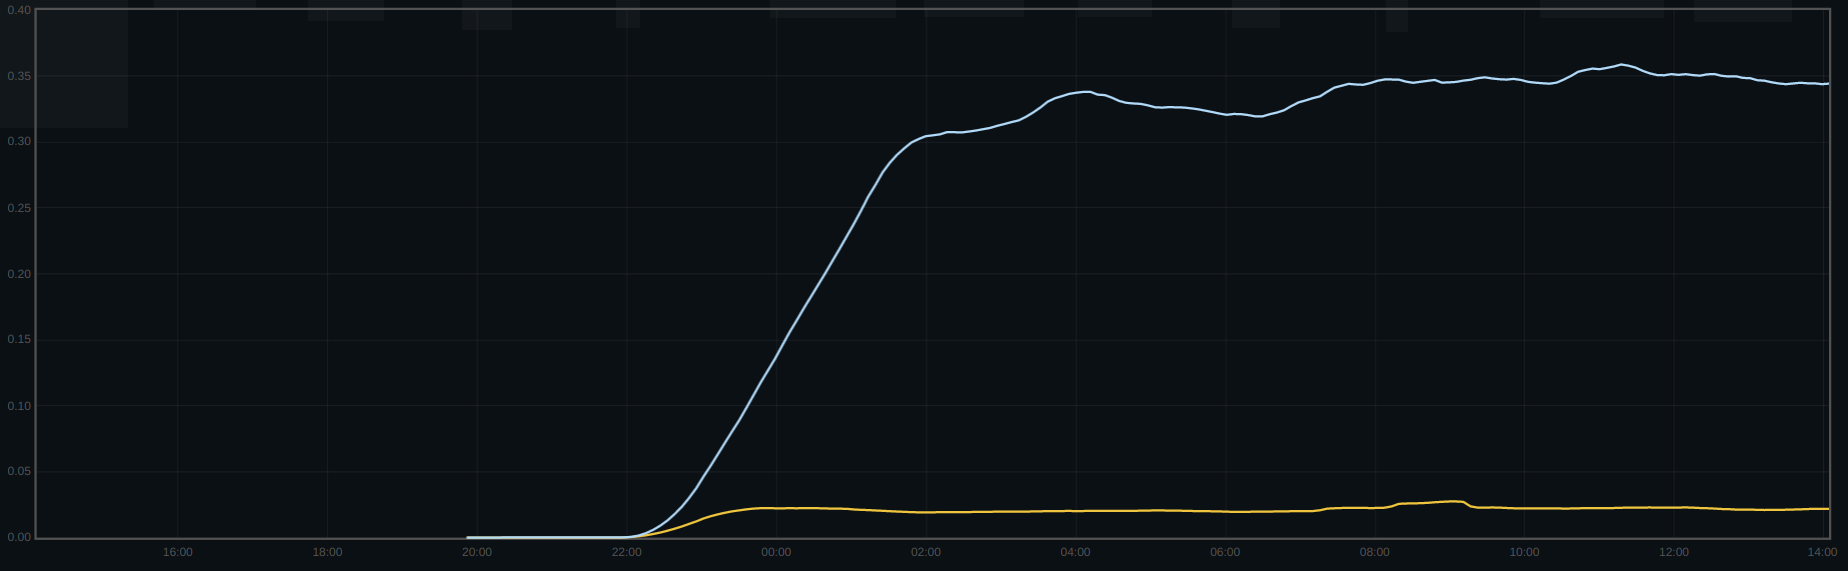
And here's logged bytes per second across the upgrade of the same clusters: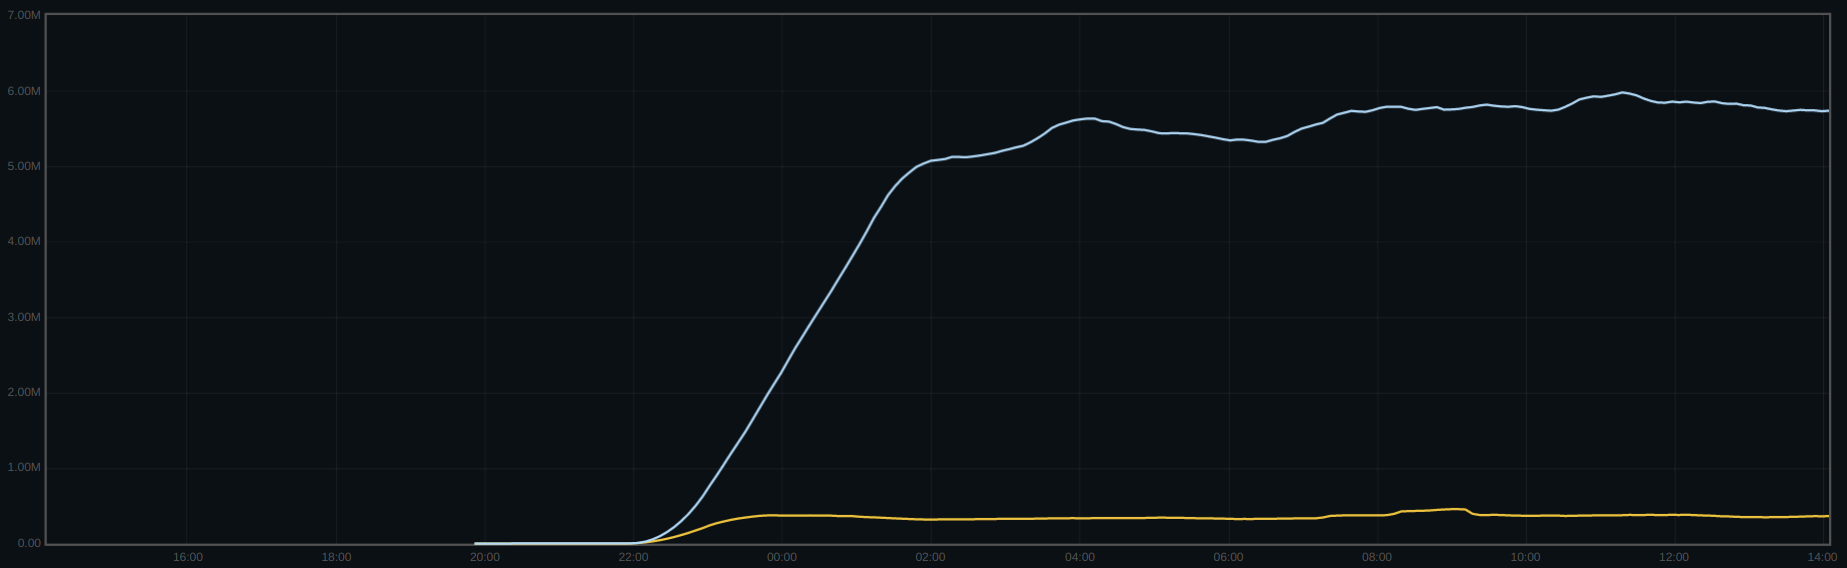
Cluster A (yellow line): 0.000008 -> 0.02 log compactions/s, 156B/s -> 350kB/s logged_bytes
Cluster B (blue line): 0.0002 -> 0.35 log compactions/s, 3.9kB/s -> 5.8MB/s logged_bytes
In the case of cluster B, across the upgrade, I see a change of 3.6 bytes written for every client byte written (Nautilus) to 5.5 bytes written for every client byte (Pacific); adding up logged_bytes, the cluster went from 0.001 logged_bytes for every client byte to 1.8 logged_bytes for every client byte, which pretty much makes up the difference.
TL;DR - I think we found the cause of the increase in disk writes between Nautilus and Pacific!
Updated by Igor Fedotov about 1 year ago
Hi Joshua,
good catch.
Now I'm wondering whether that high compaction rate persists permanently?
And if so - could you please temporarily set debug_bluefs to 10 (this doesn't need osd restart if applied through "ceph config set ...' cmd)
Then leave OSD running with that verbose logging for a while - preferably for a couple of "_compact_log_async" events - to be monitored through relevant perf counter increment or OSD log line formatted as "<timestamp> _compact_log_async"
Please share the resulting log.
Updated by Joshua Baergen about 1 year ago
Hi Igor,
Now I'm wondering whether that high compaction rate persists permanently?
Ah, sorry, I should have mentioned that. Yes, it does appear to - stats look similar (or sometimes worse! there's a lot of variance) on clusters that have been upgraded for months.
I've captured a bluefs debug log from a staging cluster - based on perf data I think it's representative of what we're seeing in production. It can be found at https://jbaergen-sfo3.sfo3.digitaloceanspaces.com/58530/ceph-osd.160.debug_bluefs.log.gz.
Let me know if I can get you anything else!
Updated by Igor Fedotov about 1 year ago
Joshua,
thanks for the log. Something interesting, indeed.
The first question would be - do you have any custom bluestore/bluefs/rocksdb settings for your clusters?
Secondly, from the log I can see a permanently growing bluefs file (ino 320161) which took ~640MB at log's collection time. Which is huge.
2023-01-31T16:05:57.560+0000 7f898c72b700 10 bluefs _fsync 0x555e28f2f200 file(ino 320161 size 0x25e7f9f4 mtime 2023-01-31T16:05:57.561163+0000 allocated 25e80000 extents...
...
2023-01-31T16:06:35.575+0000 7f898c72b700 10 bluefs _flush_range 0x555e28f2f200 pos 0x26302bdf 0x26302bdf~860 to file(ino 320161 size 0x26302bdf mtime 2023-01-31T16:06:35.562916+0000 allocated 26310000 extents...
I presume that's a culprit for bluefs log growing and its often compaction - the above mentioned file's allocation map is huge and causes faster log filling...
Now the question is what's the origin of this large file and whether it's reset at some point or not. So the investigation plan would be:
1) Check once again if the same ino 320161 is being reported in OSD log for now. Or it's been replaced with another large and frequently accessed file?
2) If so - shutdown the osd and run "ceph-bluestore-tool --command bluefs-log-dump" command to learn the mapping between inos and readable file name. I presume that's bound to rocksdb wal but let's check that..
3) Check if some other OSDs are showing the same pattern - evidently ino (and partly file name) might differ...
And honestly I'm suspecting some custom settings you might use for rocksdb... ;) No proofs so far though, so please confirm whether that's the case or now..
Updated by Igor Fedotov about 1 year ago
And one more note:
The latest Pacific release (16.2.11) might show much better behavior in terms of log compaction amounts which is apparently caused by introducing incremental op_file_update operation.
The latter avoids persisting full allocation map on every file's update and hence prevents bluefs log from fast growth. See https://github.com/ceph/ceph/pull/42750 for implementation details.
Incremental updates in 16.2.11 wouldn't fix unexpectedly high file's growth we see in the shared log though. That's still to be investigated as per the above ticket's comment.
Updated by Joshua Baergen about 1 year ago
Hi Igor,
Thanks for continuing to dig into this! Some answers to your questions:
The first question would be - do you have any custom bluestore/bluefs/rocksdb settings for your clusters?
We have bluefs_buffered_io=false; this is the only setting in this area that we override. rocksdb settings are default on these clusters. However, the Pacific defaults have max_total_wal_size=1073741824, and these WAL files are within that, no?
Check once again if the same ino 320161 is being reported in OSD log for now. Or it's been replaced with another large and frequently accessed file?
Looks like it's a different ino (320329) on this OSD when I checked today. It had reached 135MiB when I had stopped the OSD.
If so - shutdown the osd and run "ceph-bluestore-tool --command bluefs-log-dump" command to learn the mapping between inos and readable file name. I presume that's bound to rocksdb wal but let's check that..
Indeed:
0x0: op_dir_link db.wal/320347.log to 320329
Check if some other OSDs are showing the same pattern - evidently ino (and partly file name) might differ...
Yup! From another OSD (52):
2023-02-01T16:28:22.008+0000 7f42ab78f700 10 bluefs _flush_range 0x560a330823c0 pos 0x19b979a6 0x19b979a6~837 to file(ino 327 size 0x19b979a6 mtime 2023-02-01T16:28:22.007008+0000 allocated 19ba0000
0x0: op_dir_link db.wal/000331.log to 327
Booting that OSD:
2023-02-01T16:31:33.254+0000 7efed8406200 4 rocksdb: [version_set.cc:4568] Recovered from manifest file:db/MANIFEST-000033 succeeded,manifest_file_number is 33, next_file_number is 334, last_sequence is 100991046, log_number is 331,prev_log_number is 0,max_column_family is 11,min_log_number_to_keep is 0
...
2023-02-01T16:31:33.254+0000 7efed8406200 4 rocksdb: [version_set.cc:4577] Column family [L] (ID 10), log number is 331
Re: 16.2.11 - good to know! We were planning to start testing it in our lab soon. We can look for behaviour differences in this space.
Let us know if we can provide anything else!
Updated by Igor Fedotov about 1 year ago
Well, I did brief testing against 16.2.9 in my lab and I could see WAL size wrapping at ~256MB. So your case is apparently not that bad given it doesn't exceed specified 1GB. May be different access patterns (and/or legacy settings from Nautilus) cause the difference with my numbers.. Anyway the order of magnitude is pretty the same hence this factor isn't that important.
As a side note - what really matters is using co-located DB volume which results in bluefs_shared_alloc_size (=64K) being applied. Which in turn means WAL file grows in small chunks and its allocation map is huge. I'd estimate it as being at around 50K for the log you shared. Which in turn means every DB transaction (apparently bound to 4K user write) causes 50+K write to BlueFS log. Hence the amplification you're observing.
So at this point it looks like start using .11 is the best approach - this would dramatically drop log update size on each txc and hopefully effectively fix the issue.
As an interesting experiment you might want to raise bluefs_shared_alloc_size to 1M and see the impact but I would strongly discourage you to do that in production as
- I'm not completely sure if OSD starts with raised setting
- There might be some performance penalty in allocating that long continuous block at shared volume due to space fragmentation - hence the potential negative performance impact.
Updated by Joshua Baergen about 1 year ago
Thanks Igor, we'll look into 16.2.11 as well as playing with that setting soon. Any idea why this started happening in Pacific? Is it because of the bluefs allocator changes between Nautilus and Pacific, a change in rocksdb behaviour (larger WALs), or something else?
Updated by Igor Fedotov about 1 year ago
I think max_total_wal_size=1073741824 might be the culprit - as far as I can see it wasn't set in 14.2.22 by default...
Updated by Joshua Baergen about 1 year ago
FWIW, it does look like bluefs_shared_alloc_size=1M reduces bluefs log load as expected.
Updated by Joshua Baergen about 1 year ago
Per this morning's meeting, the new rocksdb tunings from main (minus TTL - wanted to try without that) appear to mitigate this problem as well.
Updated by Joshua Baergen about 1 year ago
I should be specific:
osd advanced bluestore_rocksdb_options compression=kNoCompression,max_write_buffer_number=128,min_write_buffer_number_to_merge=16,compaction_style=kCompactionStyleLevel,write_buffer_size=8388608,max_background_jobs=4,level0_file_num_compaction_trigger=8,max_bytes_for_level_base=1073741824,max_bytes_for_level_multiplier=8,compaction_readahead_size=2MB,max_total_wal_size=1073741824,writable_file_max_buffer_size=0 *
Updated by Joshua Baergen about 1 year ago
For the staging cluster I've been using, 16.2.11 also addresses the high bluefs logged_bytes rate. All three options tried (bluefs_shared_alloc_size=1M, bluestore_rocksdb_options, 16.2.11) have a similar result: bluefs logged_bytes drops from 0.4-8.5MB/s to 270-300KB/s, and compactions of course drops accordingly. 16.2.11 seems to have had the greatest effect, tending towards 270KB/s most of the time.
Next up will be trying this out in production to ensure it addresses the macro issues we see there, but that likely won't be for a couple of weeks.
Updated by Joshua Baergen about 1 year ago
Hi Igor, we have our first datapoint regarding 16.2.11: While it appears to return write byte amplification to Nautilus levels, it has had little effect on write IOPS amplification. Perhaps this isn't entirely surprising given that the number of bluefs log writes won't change, they'll just be smaller (right?). Is there a perf stat that tracks how many bluefs log writes are done? I didn't see one in "perf dump", but I could have been looking in the wrong place.
Updated by Igor Fedotov about 1 year ago
Joshua Baergen wrote:
Hi Igor, we have our first datapoint regarding 16.2.11: While it appears to return write byte amplification to Nautilus levels, it has had little effect on write IOPS amplification. Perhaps this isn't entirely surprising given that the number of bluefs log writes won't change, they'll just be smaller (right?). Is there a perf stat that tracks how many bluefs log writes are done? I didn't see one in "perf dump", but I could have been looking in the wrong place.
So the first graph from the description is still valid while the second one isn't, right?
hmm... and stats for deferred writes are pretty the same, aren't they?
W.r.t. stats for bluefs write count - no, unfortunately they aren't there. The only experiment which comes to my mind is to allocate/attach standalone DB volume (via ceph-bluestore-tool) and start tracking its IOPS using regular means, e.g. via iostat. So you will get some clue if IOPS increase is bound to DB traffic rather than user data one. And even further - introduce separate DB and WAL volumes...
Well alternative approach would be OSD log analysis - with debug-bluefs set to 10 as the first step. Might be tricky though...
Updated by Joshua Baergen about 1 year ago
- File 2023-02-16 Deferred Bytes by Host.png 2023-02-16 Deferred Bytes by Host.png added
- File 2023-02-16 Deferred Ops by Host.png 2023-02-16 Deferred Ops by Host.png added
- File 2023-02-16 Write Byte Amp.png 2023-02-16 Write Byte Amp.png added
- File 2023-02-16 Write Op Amp.png 2023-02-16 Write Op Amp.png added
Hey Igor,
Let me attach some updated pictures from the production system in question. They all include 14.2.18, 16.2.9 (starting Jan. 26ish), and 16.2.11 (starting Feb. 13ish), and are time-averaged over a day to try to smooth out daily cycles.
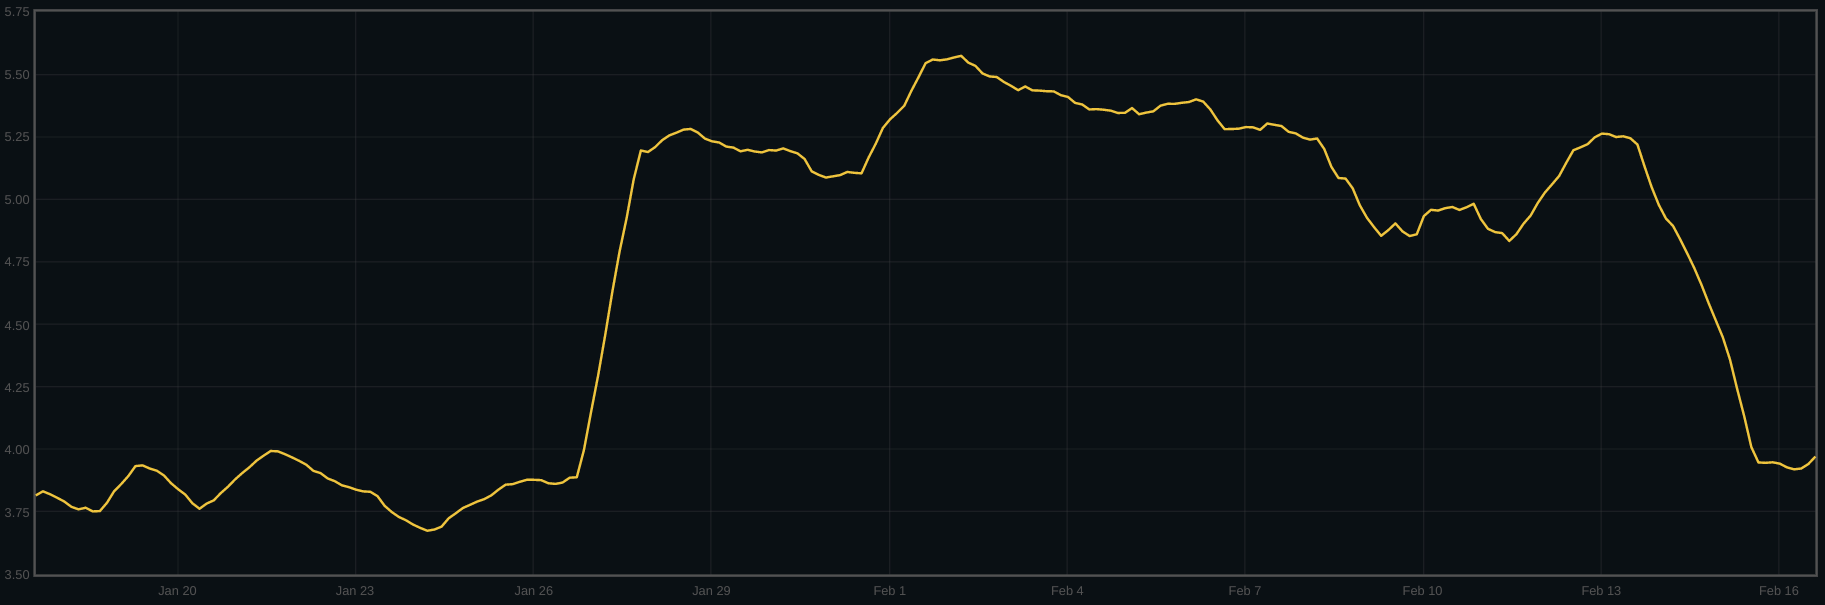
Write op amplification:
!2023-02-16 Write Op Amp.png!
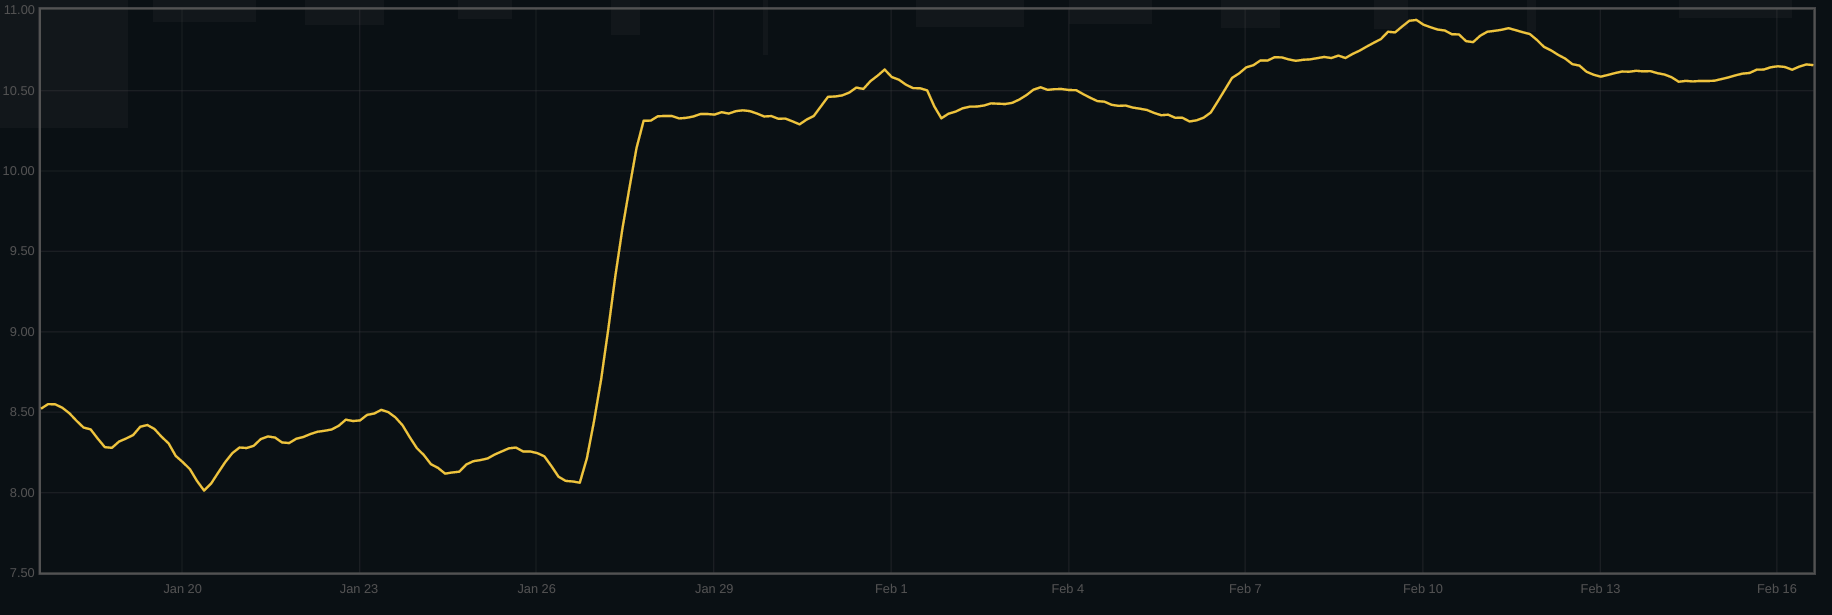
Write byte amplification:
!2023-02-16 Write Byte Amp.png!
Deferred ops per second, by host:
!2023-02-16 Deferred Ops by Host.png!
Deferred bytes per second, by host:
!2023-02-16 Deferred Bytes by Host.png!
So, to my eyes, deferred ops are mostly unchanged through the series of updates. Write byte amplification is not actually exactly the same as Nautilus post-16.2.11, but it's close enough and without several days of data the difference could just be due to a weekly cycle. Write op amplification remains the same between 16.2.9 and 16.2.11, and is maybe increasing over time a bit but again that could be cyclical.
We'll give some thought to how to get some better observability into the writes going to the various pieces. Maybe we'll add some new perf stats for that.
Updated by Joshua Baergen about 1 year ago
Hey Igor,
Using the new metrics from https://github.com/ceph/ceph/pull/50245 in our staging environment, it became pretty clear that (almost) every rocksdb WAL write had an associated bluefs log write. Looking at the logs, this is because the WAL size changes each time, which means the inode needs to be updated.
Looking at logs from a Nautilus cluster, I don't see this, and I'm pretty convinced it's because log recycling still happens on Nautilus but was disabled in rocksdb between then and Pacific. On Nautilus, when log recycling is happening, the file size remains constant, and thus once a rocksdb WAL is fully sized, no more inode updates are required.
At least for this staging cluster, this works out to be an extra 0.5 writes per client write op. I don't have production data yet to see if it fully explains what's happening there.
Updated by Igor Fedotov about 1 year ago
Hi Joshua,
likely your root cause analysis is valid and rocksdb's recycle_log_file_num options works differently at Nautilus (currently it's a no-op IIUC, see https://ceph.io/en/news/blog/2022/rocksdb-tuning-deep-dive/)
You might want to double check this hypothesis through nautilus bluefs log analysis - WAL inodes shouldn't show that frequent op_file_update entities in it. Also the relevant WAL inode ids should be rather unmodified over time.
Anyway if your analysis is correct I doubt we'll change the behavior any time soon - the amount of needful efforts is pretty high while IIUC the overall performance impact is rather neglectable (at least for flash drives), isn't it?
Updated by Joshua Baergen about 1 year ago
Hi Igor,
Yes, that is what I observe in Nautilus - far fewer updates to the file metadata.
It does appear that the extra write is not causing much in the way of performance issues for the majority of our flash systems. We have some older drives that are struggling a bit, particularly because they have a lot of deferred writes (16k MAS) and these deferred writes now have that extra metadata update.
At this point, we're more worried about the effect this will have on our HDD-based nodes on the object side. We have not yet begun to characterize Pacific on those nodes.
I spent a bit of time looking at the rocksdb code and configuration to understand what options might be available. It looks like rocksdb does have methods to mitigate this such as pre-expanding WALs via `Allocate()` calls to the backing store (maps to fallocate on POSIX), for example, but I imagine that implementing this scheme efficiently in bluefs would be a bit of effort.
Updated by Konstantin Shalygin 12 months ago
Also, Joshua should we set PR ID for this issue https://github.com/ceph/ceph/pull/50245 and then backport?
Updated by Igor Fedotov 12 months ago
Konstantin Shalygin wrote:
Also, Joshua should we set PR ID for this issue https://github.com/ceph/ceph/pull/50245 and then backport?
IMO linking this PR to the ticket makes a little sense - the PR just introduces a bunch of new perf counters, it doesn't fix the problem in any way..
Updated by Igor Fedotov 12 months ago
Updated by Konstantin Shalygin 11 months ago
- Related to Bug #61466: Add bluefs write op count metrics added