Bug #58528
openmsgr: Significant write stalls encountered when the messenger throttle activates
0%
Description
Since upgrading from 14.2.18 to 16.2.9, we've witnessed fairly regular write stalls. Take for example this graph below which shows max latency for three different clusters over time as measured by a synthetic test that we constantly run: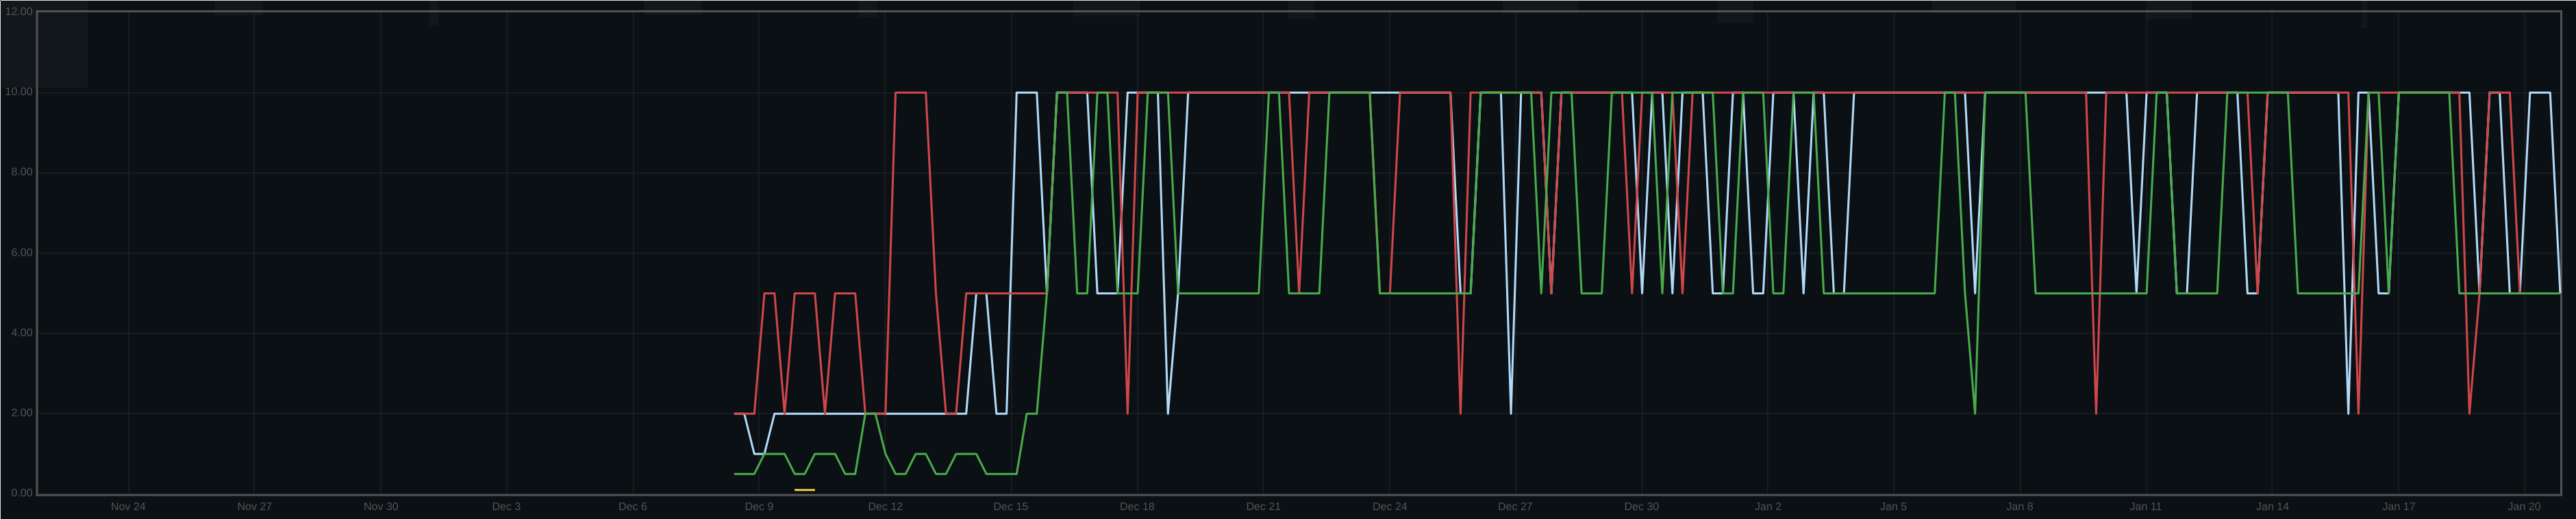
The synthetic test uses a 10s rados op timeout, and that's why the graph clips at that value. The Pacific upgrade occurred around Dec. 15.
In some cases, these stalls can last for minutes - here's a case where the synthetic was timing out for several minutes: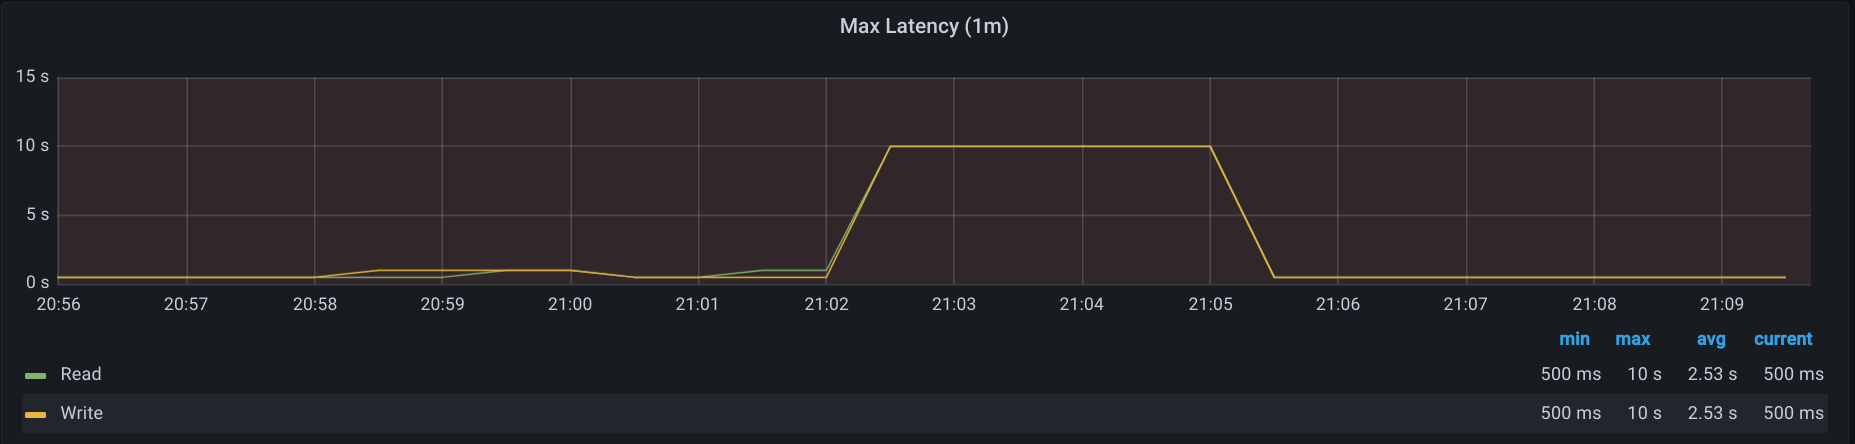
In order to help track this down, we enabled debug_ms=1 in the synthetic client for the worst of the clusters we investigated and wrote a parser that would look for long or timed-out OSD ops. For each of these stalls, it was always a single OSD that was causing the stalls for that time period.
Digging into one of these OSDs, we found this:
    "throttle-osd_client_messages": {
        "val": 0,
        "max": 256,
        "get_started": 0,
        "get": 5179312,
        "get_sum": 5179312,
        "get_or_fail_fail": 258569,
        "get_or_fail_success": 5179312,
        "take": 0,
        "take_sum": 0,
        "put": 5179312,
        "put_sum": 5179312,
        "wait": {
            "avgcount": 0,
            "sum": 0.000000000,
            "avgtime": 0.000000000
        }
    }
That's a significant amount of throttled messages. In the steady state, we do not see throttling.
In 14.2.18, this throttle was off, which is why we didn't see these spikes in that release; it was re-enabled via https://tracker.ceph.com/issues/49894.
We're trying a higher value for this throttle (osd_client_message_cap=4096 to start), and if that's sufficient then perhaps that means that it needs to be updated, or increase for systems with faster media. IMO, that's only part of the issue, though; even if it overly throttled, it doesn't make sense that we'd see minutes-long starvation for some clients.
I took a look at how throttling works in msgr and I'm concerned that the algorithm does little to prevent starvation. AIUI, as soon as any connection cannot obtain the throttle resources it needs to accept a message, the connection is put on a 1ms timer for re-evaluation. There is no attempt to FIFO messages or connections, and thus one noisy connection can easily keep the msgr busy, causing multiple other connections to simply be delayed over and over again until the msgr finally has enough resources to start processing the delayed connections. Is that correct?
I'll report back here with the results of our experimentation with higher throttle configuration.
Files
Updated by Joshua Baergen about 1 year ago
Oh, and one other note - the clusters never report slow ops when these latency spikes occur.
Updated by Joshua Baergen about 1 year ago
Ah, one more note: This is an RBD workload.
Updated by Joshua Baergen about 1 year ago
We found that even 4096 wasn't sufficient in some cases; bumping to 16384 resulted in the following:
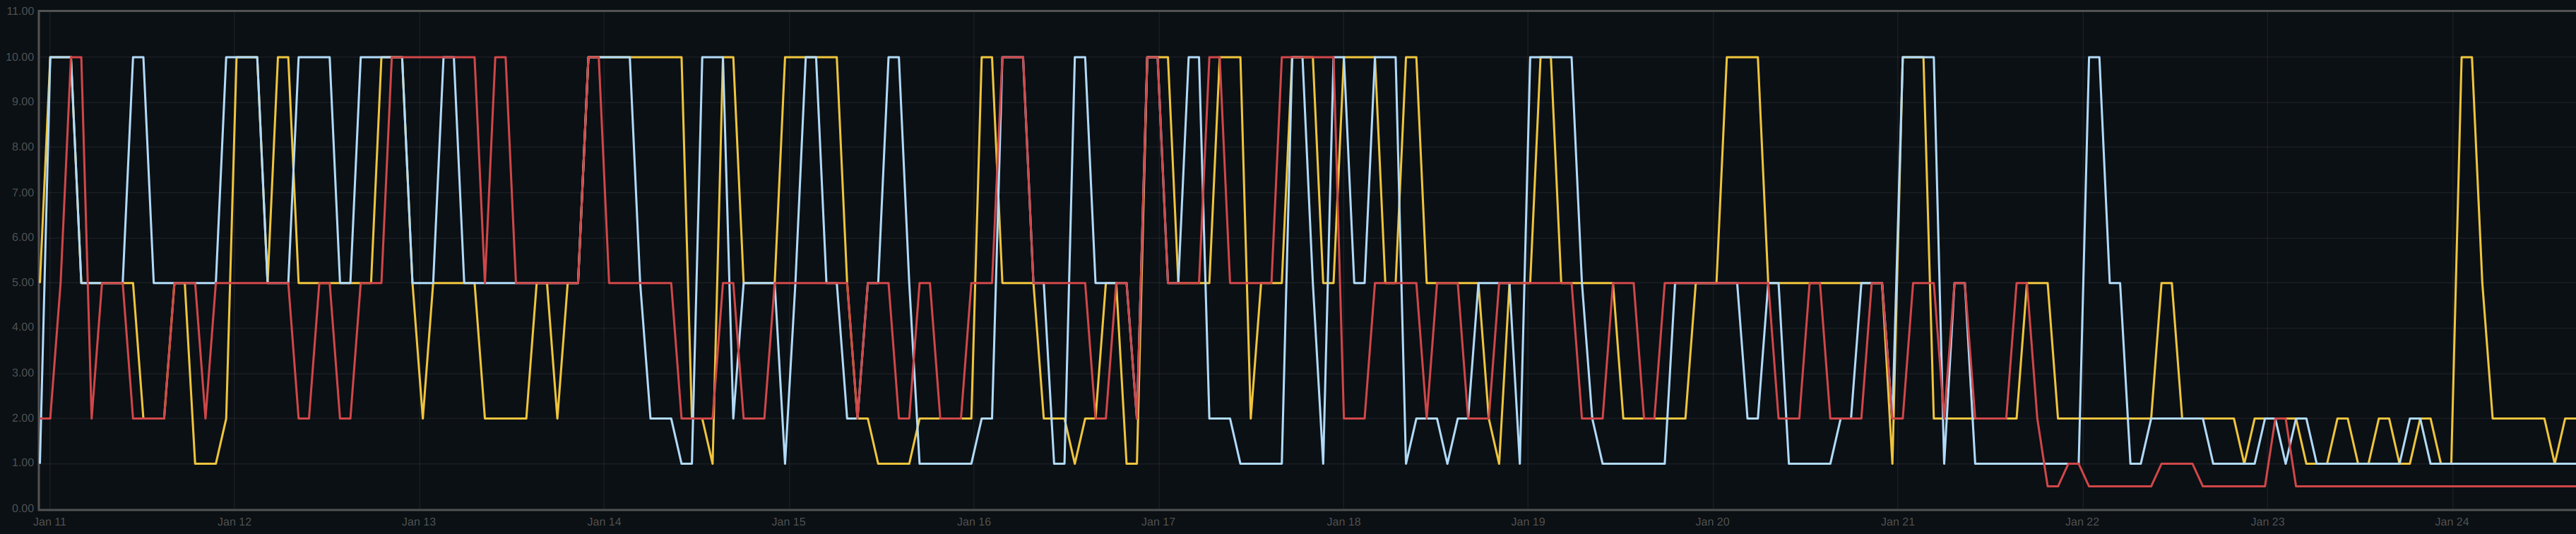
So, much better overall, with occasional spikes. We're now trying with the throttle entirely disabled, which is how we ran Luminous.