Support #57952
openPacific: the buffer_anon_bytes of ceph-mds is too large
0%
Description
The buffer_anon_bytes will reach 200+GB, then run out of machine memory.It does not seem to be able to effectively free its own memory.I restart the active mds when out of memory, how can I control the memory?
ceph version: 16.2.7
mds basic mds_cache_memory_limit 17179869184
======
RANK STATE MDS ACTIVITY DNS INOS DIRS CAPS
0 active cephfs.CEPH-FS-05.qacnfw Reqs: 337 /s 5603k 5602k 20.9k 4271k
1 active cephfs.CEPH-FS-04.wtsyvt Reqs: 33 /s 5820k 5820k 2781 2710k
2 active cephfs.CEPH-FS-01.clgetg Reqs: 15 /s 2658k 2658k 2809 840k
0-s standby-replay cephfs.CEPH-FS-10.yemgde Evts: 143 /s 9637k 9635k 25.7k 0
2-s standby-replay cephfs.CEPH-FS-08.asiflv Evts: 22 /s 690k 688k 1755 0
1-s standby-replay cephfs.CEPH-FS-09.bmlqxn Evts: 48 /s 4061k 4061k 1963 0
POOL TYPE USED AVAIL
cephfs.cephfs.meta metadata 72.3G 402T
cephfs.cephfs.data data 369T 402T
ceph -s:
cluster:
    health: HEALTH_WARN
            1 stray daemon(s) not managed by cephadm
services:
mon: 5 daemons, quorum CEPH-FS-01,CEPH-FS-02,CEPH-FS-03,CEPH-FS-06,CEPH-FS-09 (age 8M)
mgr: CEPH-FS-04.mriyac(active, since 4d), standbys: CEPH-FS-02.vaogxo, CEPH-FS-07.fqhjfq
mds: 3/3 daemons up, 3 hot standby
osd: 240 osds: 239 up (since 7d), 239 in (since 5w)data:
volumes: 1/1 healthy
pools: 4 pools, 10304 pgs
objects: 67.41M objects, 123 TiB
usage: 473 TiB used, 1.3 PiB / 1.8 PiB avail
pgs: 10302 active+clean
2 active+clean+scrubbing+deepio:
client: 197 MiB/s rd, 387 MiB/s wr, 817 op/s rd, 600 op/s wrperf dump:
{
"AsyncMessenger::Worker-0": {
"msgr_recv_messages": 16370209,
"msgr_send_messages": 183947373,
"msgr_recv_bytes": 433636160583,
"msgr_send_bytes": 579290743028,
"msgr_created_connections": 144,
"msgr_active_connections": 100,
"msgr_running_total_time": 2867.244083208,
"msgr_running_send_time": 1417.136170370,
"msgr_running_recv_time": 8692.394676076,
"msgr_running_fast_dispatch_time": 178.050138411,
"msgr_send_messages_queue_lat": {
"avgcount": 183947372,
"sum": 642236.224002186,
"avgtime": 0.003491412
},
"msgr_handle_ack_lat": {
"avgcount": 23233913,
"sum": 48.615040803,
"avgtime": 0.000002092
}
},
"AsyncMessenger::Worker-1": {
"msgr_recv_messages": 12293525,
"msgr_send_messages": 261698317,
"msgr_recv_bytes": 149992015800,
"msgr_send_bytes": 311875447239,
"msgr_created_connections": 177,
"msgr_active_connections": 109,
"msgr_running_total_time": 2594.774630731,
"msgr_running_send_time": 1517.533019476,
"msgr_running_recv_time": 4329.976979555,
"msgr_running_fast_dispatch_time": 177.928184789,
"msgr_send_messages_queue_lat": {
"avgcount": 261698312,
"sum": 1192592.614559400,
"avgtime": 0.004557127
},
"msgr_handle_ack_lat": {
"avgcount": 16643988,
"sum": 65.857231243,
"avgtime": 0.000003956
}
},
"AsyncMessenger::Worker-2": {
"msgr_recv_messages": 24395777,
"msgr_send_messages": 367204993,
"msgr_recv_bytes": 498806848851,
"msgr_send_bytes": 818621986063,
"msgr_created_connections": 137,
"msgr_active_connections": 103,
"msgr_running_total_time": 4501.246188575,
"msgr_running_send_time": 2469.332205573,
"msgr_running_recv_time": 11125.517382072,
"msgr_running_fast_dispatch_time": 175.570299814,
"msgr_send_messages_queue_lat": {
"avgcount": 367204991,
"sum": 1633537.856159361,
"avgtime": 0.004448572
},
"msgr_handle_ack_lat": {
"avgcount": 33656474,
"sum": 94.974918408,
"avgtime": 0.000002821
}
},
"cct": {
"total_workers": 1,
"unhealthy_workers": 0
},
"finisher-MDSRank": {
"queue_len": 0,
"complete_latency": {
"avgcount": 4980999,
"sum": 18728.596361581,
"avgtime": 0.003760008
}
},
"finisher-PurgeQueue": {
"queue_len": 0,
"complete_latency": {
"avgcount": 2365269,
"sum": 2036.679868866,
"avgtime": 0.000861077
}
},
"mds": {
"request": 20795793,
"reply": 20208535,
"reply_latency": {
"avgcount": 20208535,
"sum": 139201.834570701,
"avgtime": 0.006888269
},
"forward": 587209,
"dir_fetch": 714750,
"dir_commit": 332181,
"dir_split": 0,
"dir_merge": 0,
"inodes": 5955070,
"inodes_top": 3134539,
"inodes_bottom": 2819552,
"inodes_pin_tail": 979,
"inodes_pinned": 1477157,
"inodes_expired": 1434197661,
"inodes_with_caps": 1474722,
"caps": 1476742,
"subtrees": 249,
"traverse": 41161541,
"traverse_hit": 36734230,
"traverse_forward": 540281,
"traverse_discover": 649772,
"traverse_dir_fetch": 204489,
"traverse_remote_ino": 19,
"traverse_lock": 39426,
"load_cent": 193582,
"q": 23,
"exported": 469028,
"exported_inodes": 795409004,
"imported": 442709,
"imported_inodes": 0,
"openino_dir_fetch": 13,
"openino_backtrace_fetch": 4,
"openino_peer_discover": 194,
"root_rfiles": 34343190,
"root_rbytes": 135404104930419,
"root_rsnaps": 0,
"scrub_backtrace_fetch": 0,
"scrub_set_tag": 0,
"scrub_backtrace_repaired": 0,
"scrub_inotable_repaired": 0,
"scrub_dir_inodes": 0,
"scrub_dir_base_inodes": 0,
"scrub_dirfrag_rstats": 0,
"scrub_file_inodes": 0,
"handle_inode_file_caps": 17370,
"ceph_cap_op_revoke": 1162253,
"ceph_cap_op_grant": 2090084,
"ceph_cap_op_trunc": 18659,
"ceph_cap_op_flushsnap_ack": 0,
"ceph_cap_op_flush_ack": 14,
"handle_client_caps": 2696483,
"handle_client_caps_dirty": 1048322,
"handle_client_cap_release": 3495639,
"process_request_cap_release": 2050680
},
"mds_cache": {
"num_strays": 23,
"num_strays_delayed": 0,
"num_strays_enqueuing": 0,
"strays_created": 539355,
"strays_enqueued": 534119,
"strays_reintegrated": 9296,
"strays_migrated": 0,
"num_recovering_processing": 0,
"num_recovering_enqueued": 0,
"num_recovering_prioritized": 0,
"recovery_started": 98,
"recovery_completed": 98,
"ireq_enqueue_scrub": 0,
"ireq_exportdir": 469914,
"ireq_flush": 0,
"ireq_fragmentdir": 0,
"ireq_fragstats": 0,
"ireq_inodestats": 0
},
"mds_log": {
"evadd": 6329631,
"evex": 6330654,
"evtrm": 6330654,
"ev": 408991,
"evexg": 0,
"evexd": 41,
"segadd": 87841,
"segex": 87841,
"segtrm": 87841,
"seg": 131,
"segexg": 0,
"segexd": 3,
"expos": 56620245735538,
"wrpos": 56620833075059,
"rdpos": 56223572874642,
"jlat": {
"avgcount": 2785731,
"sum": 98148.573380290,
"avgtime": 0.035232609
},
"replayed": 410014
},
"mds_mem": {
"ino": 5955075,
"ino+": 1493782999,
"ino-": 1487827924,
"dir": 13752,
"dir+": 3178548,
"dir-": 3164796,
"dn": 5955503,
"dn+": 1495130263,
"dn-": 1489174760,
"cap": 1476742,
"cap+": 1058089127,
"cap-": 1056612385,
"rss": 124566472,
"heap": 356584
},
"mds_server": {
"dispatch_client_request": 23744376,
"dispatch_server_request": 1334942,
"handle_client_request": 20795793,
"handle_client_session": 622953,
"handle_peer_request": 2235037,
"req_create_latency": {
"avgcount": 378238,
"sum": 3718.651563455,
"avgtime": 0.009831512
},
"req_getattr_latency": {
"avgcount": 13297112,
"sum": 29253.706317883,
"avgtime": 0.002200004
},
"req_getfilelock_latency": {
"avgcount": 0,
"sum": 0.000000000,
"avgtime": 0.000000000
},
"req_link_latency": {
"avgcount": 8148,
"sum": 76.390035683,
"avgtime": 0.009375311
},
"req_lookup_latency": {
"avgcount": 3684317,
"sum": 40277.521545426,
"avgtime": 0.010932154
},
"req_lookuphash_latency": {
"avgcount": 0,
"sum": 0.000000000,
"avgtime": 0.000000000
},
"req_lookupino_latency": {
"avgcount": 1101,
"sum": 17.600041252,
"avgtime": 0.015985505
},
"req_lookupname_latency": {
"avgcount": 0,
"sum": 0.000000000,
"avgtime": 0.000000000
},
"req_lookupparent_latency": {
"avgcount": 0,
"sum": 0.000000000,
"avgtime": 0.000000000
},
"req_lookupsnap_latency": {
"avgcount": 0,
"sum": 0.000000000,
"avgtime": 0.000000000
},
"req_lssnap_latency": {
"avgcount": 26,
"sum": 0.000908458,
"avgtime": 0.000034940
},
"req_mkdir_latency": {
"avgcount": 64477,
"sum": 376.260622307,
"avgtime": 0.005835578
},
"req_mknod_latency": {
"avgcount": 0,
"sum": 0.000000000,
"avgtime": 0.000000000
},
"req_mksnap_latency": {
"avgcount": 0,
"sum": 0.000000000,
"avgtime": 0.000000000
},
"req_open_latency": {
"avgcount": 104344,
"sum": 1068.515421004,
"avgtime": 0.010240314
},
"req_readdir_latency": {
"avgcount": 1243940,
"sum": 24302.960426370,
"avgtime": 0.019537084
},
"req_rename_latency": {
"avgcount": 539682,
"sum": 31433.161985966,
"avgtime": 0.058243858
},
"req_renamesnap_latency": {
"avgcount": 0,
"sum": 0.000000000,
"avgtime": 0.000000000
},
"req_rmdir_latency": {
"avgcount": 51748,
"sum": 1556.740763795,
"avgtime": 0.030083109
},
"req_rmsnap_latency": {
"avgcount": 0,
"sum": 0.000000000,
"avgtime": 0.000000000
},
"req_rmxattr_latency": {
"avgcount": 45,
"sum": 0.581909728,
"avgtime": 0.012931327
},
"req_setattr_latency": {
"avgcount": 18533,
"sum": 823.489016187,
"avgtime": 0.044433659
},
"req_setdirlayout_latency": {
"avgcount": 0,
"sum": 0.000000000,
"avgtime": 0.000000000
},
"req_setfilelock_latency": {
"avgcount": 360268,
"sum": 3071.478759118,
"avgtime": 0.008525538
},
"req_setlayout_latency": {
"avgcount": 0,
"sum": 0.000000000,
"avgtime": 0.000000000
},
"req_setxattr_latency": {
"avgcount": 109,
"sum": 0.528619447,
"avgtime": 0.004849719
},
"req_symlink_latency": {
"avgcount": 0,
"sum": 0.000000000,
"avgtime": 0.000000000
},
"req_unlink_latency": {
"avgcount": 456447,
"sum": 3224.246634622,
"avgtime": 0.007063791
},
"cap_revoke_eviction": 0,
"cap_acquisition_throttle": 1077
},
"mds_sessions": {
"session_count": 78,
"session_add": 113,
"session_remove": 35,
"sessions_open": 78,
"sessions_stale": 0,
"total_load": 23309,
"average_load": 298,
"avg_session_uptime": 22308641
},
"mempool": {
"bloom_filter_bytes": 249941,
"bloom_filter_items": 249941,
"bluestore_alloc_bytes": 0,
"bluestore_alloc_items": 0,
"bluestore_cache_data_bytes": 0,
"bluestore_cache_data_items": 0,
"bluestore_cache_onode_bytes": 0,
"bluestore_cache_onode_items": 0,
"bluestore_cache_meta_bytes": 0,
"bluestore_cache_meta_items": 0,
"bluestore_cache_other_bytes": 0,
"bluestore_cache_other_items": 0,
"bluestore_Buffer_bytes": 0,
"bluestore_Buffer_items": 0,
"bluestore_Extent_bytes": 0,
"bluestore_Extent_items": 0,
"bluestore_Blob_bytes": 0,
"bluestore_Blob_items": 0,
"bluestore_SharedBlob_bytes": 0,
"bluestore_SharedBlob_items": 0,
"bluestore_inline_bl_bytes": 0,
"bluestore_inline_bl_items": 0,
"bluestore_fsck_bytes": 0,
"bluestore_fsck_items": 0,
"bluestore_txc_bytes": 0,
"bluestore_txc_items": 0,
"bluestore_writing_deferred_bytes": 0,
"bluestore_writing_deferred_items": 0,
"bluestore_writing_bytes": 0,
"bluestore_writing_items": 0,
"bluefs_bytes": 0,
"bluefs_items": 0,
"bluefs_file_reader_bytes": 0,
"bluefs_file_reader_items": 0,
"bluefs_file_writer_bytes": 0,
"bluefs_file_writer_items": 0,
"buffer_anon_bytes": 90086214407,
"buffer_anon_items": 22546227,
"buffer_meta_bytes": 0,
"buffer_meta_items": 0,
"osd_bytes": 0,
"osd_items": 0,
"osd_mapbl_bytes": 0,
"osd_mapbl_items": 0,
"osd_pglog_bytes": 0,
"osd_pglog_items": 0,
"osdmap_bytes": 106368,
"osdmap_items": 3613,
"osdmap_mapping_bytes": 0,
"osdmap_mapping_items": 0,
"pgmap_bytes": 0,
"pgmap_items": 0,
"mds_co_bytes": 16207994675,
"mds_co_items": 129354997,
"unittest_1_bytes": 0,
"unittest_1_items": 0,
"unittest_2_bytes": 0,
"unittest_2_items": 0
},
"objecter": {
"op_active": 0,
"op_laggy": 0,
"op_send": 7315122,
"op_send_bytes": 398341425244,
"op_resend": 4,
"op_reply": 7315122,
"oplen_avg": {
"avgcount": 7315122,
"sum": 10193882
},
"op": 7315122,
"op_r": 1381462,
"op_w": 5933660,
"op_rmw": 0,
"op_pg": 0,
"osdop_stat": 301134,
"osdop_create": 411760,
"osdop_read": 75421,
"osdop_write": 2852144,
"osdop_writefull": 45500,
"osdop_writesame": 0,
"osdop_append": 0,
"osdop_zero": 2,
"osdop_truncate": 0,
"osdop_delete": 2256973,
"osdop_mapext": 0,
"osdop_sparse_read": 0,
"osdop_clonerange": 0,
"osdop_getxattr": 713548,
"osdop_setxattr": 823520,
"osdop_cmpxattr": 0,
"osdop_rmxattr": 0,
"osdop_resetxattrs": 0,
"osdop_call": 0,
"osdop_watch": 0,
"osdop_notify": 0,
"osdop_src_cmpxattr": 0,
"osdop_pgls": 0,
"osdop_pgls_filter": 0,
"osdop_other": 18587,
"linger_active": 0,
"linger_send": 0,
"linger_resend": 0,
"linger_ping": 0,
"poolop_active": 0,
"poolop_send": 0,
"poolop_resend": 0,
"poolstat_active": 0,
"poolstat_send": 0,
"poolstat_resend": 0,
"statfs_active": 0,
"statfs_send": 0,
"statfs_resend": 0,
"command_active": 0,
"command_send": 0,
"command_resend": 0,
"map_epoch": 87026,
"map_full": 0,
"map_inc": 152,
"osd_sessions": 239,
"osd_session_open": 243,
"osd_session_close": 4,
"osd_laggy": 0,
"omap_wr": 643210,
"omap_rd": 1997693,
"omap_del": 54390
},
"oft": {
"omap_total_objs": 0,
"omap_total_kv_pairs": 0,
"omap_total_updates": 0,
"omap_total_removes": 0
},
"purge_queue": {
"pq_executing_ops": 0,
"pq_executing_ops_high_water": 640,
"pq_executing": 0,
"pq_executing_high_water": 64,
"pq_executed": 534119,
"pq_item_in_journal": 0
},
"throttle-msgr_dispatch_throttler-mds": {
"val": 136,
"max": 104857600,
"get_started": 0,
"get": 53059508,
"get_sum": 1077807243172,
"get_or_fail_fail": 0,
"get_or_fail_success": 53059508,
"take": 0,
"take_sum": 0,
"put": 53059507,
"put_sum": 1077807243036,
"wait": {
"avgcount": 0,
"sum": 0.000000000,
"avgtime": 0.000000000
}
},
"throttle-objecter_bytes": {
"val": 0,
"max": 104857600,
"get_started": 0,
"get": 0,
"get_sum": 0,
"get_or_fail_fail": 0,
"get_or_fail_success": 0,
"take": 7315122,
"take_sum": 432013047095,
"put": 7315122,
"put_sum": 432013047095,
"wait": {
"avgcount": 0,
"sum": 0.000000000,
"avgtime": 0.000000000
}
},
"throttle-objecter_ops": {
"val": 0,
"max": 1024,
"get_started": 0,
"get": 0,
"get_sum": 0,
"get_or_fail_fail": 0,
"get_or_fail_success": 0,
"take": 7315122,
"take_sum": 7315122,
"put": 7315122,
"put_sum": 7315122,
"wait": {
"avgcount": 0,
"sum": 0.000000000,
"avgtime": 0.000000000
}
},
"throttle-write_buf_throttle": {
"val": 0,
"max": 3758096384,
"get_started": 0,
"get": 534119,
"get_sum": 53946019,
"get_or_fail_fail": 0,
"get_or_fail_success": 534119,
"take": 0,
"take_sum": 0,
"put": 60407,
"put_sum": 53946019,
"wait": {
"avgcount": 0,
"sum": 0.000000000,
"avgtime": 0.000000000
}
},
"throttle-write_buf_throttle-0x55bd70d983c0": {
"val": 3193,
"max": 3758096384,
"get_started": 0,
"get": 6329631,
"get_sum": 397260189974,
"get_or_fail_fail": 0,
"get_or_fail_success": 6329631,
"take": 0,
"take_sum": 0,
"put": 2785731,
"put_sum": 397260186781,
"wait": {
"avgcount": 0,
"sum": 0.000000000,
"avgtime": 0.000000000
}
}
}
Files
Updated by Venky Shankar over 1 year ago
- Category set to Administration/Usability
- Assignee set to Venky Shankar
- Target version set to v18.0.0
Updated by Venky Shankar over 1 year ago
Could you share the output of
ceph tell mds.<> heap stats
Also, does running
ceph tell mds.<> heap release
reduce memory pressure?
Updated by xianpao chen over 1 year ago
Venky Shankar wrote:
Could you share the output of
[...]
Also, does running
[...]
reduce memory pressure?
I used to run heap release, but it didn't seem to work. I remount the directory of the clients and replace some kernel mounts with fuse, no exception has occurred in recent days.If the problem arises again, I will get heap stats.
I found the value of session_cache_liveness is so high, I'm not sure what it stands for, maybe the clients are under too much pressure.
one of the clients session:
{
"id": 2340609,
"entity": {
"name": {
"type": "client",
"num": 2340609
},
"addr": {
"type": "v1",
"addr": "172.20.147.32:0",
"nonce": 160998673
}
},
"state": "open",
"num_leases": 11,
"num_caps": 798820,
"request_load_avg": 2494,
"uptime": 231069.475750527,
"requests_in_flight": 1,
"num_completed_requests": 0,
"num_completed_flushes": 0,
"reconnecting": false,
"recall_caps": {
"value": 0,
"halflife": 60
},
"release_caps": {
"value": 654871.50554496993,
"halflife": 60
},
"recall_caps_throttle": {
"value": 0,
"halflife": 1.5
},
"recall_caps_throttle2o": {
"value": 0,
"halflife": 0.5
},
"session_cache_liveness": {
"value": 4549589.1180341952,
"halflife": 300
},
"cap_acquisition": {
"value": 3364.8737607100775,
"halflife": 10
},
"delegated_inos": [],
"inst": "client.2340609 v1:172.20.147.32:0/160998673",
"completed_requests": [],
"prealloc_inos": [
{
"start": "0x10005df656b",
"length": 63
},
{
"start": "0x10005df7168",
"length": 501
}
],
"client_metadata": {
"client_features": {
"feature_bits": "0x0000000000001bff"
},
"metric_spec": {
"metric_flags": {
"feature_bits": "0x"
}
},
"entity_id": "hdfs",
"hostname": "client01",
"kernel_version": "5.4.206-1.el7.elrepo.x86_64",
"root": "/hdfs"
}
},
Updated by xianpao chen over 1 year ago
Venky Shankar wrote:
Could you share the output of
[...]
Also, does running
[...]
reduce memory pressure?
This is the normal status information.It currently uses the most memory in active mdss.
root@CEPH-FS-01:~# ceph tell mds.0 heap stats
2022-11-09T17:28:35.922+0800 7fc96e7f4700 0 client.2374501 ms_handle_reset on v2:172.20.134.110:6800/1272146186
2022-11-09T17:28:35.942+0800 7fc96e7f4700 0 client.2376017 ms_handle_reset on v2:172.20.134.110:6800/1272146186
mds.cephfs.CEPH-FS-10.yemgde tcmalloc heap stats:------------------------------------------------
MALLOC: 58887893272 (56159.9 MiB) Bytes in use by application
MALLOC: + 339550208 ( 323.8 MiB) Bytes in page heap freelist
MALLOC: + 1759455168 ( 1677.9 MiB) Bytes in central cache freelist
MALLOC: + 352256 ( 0.3 MiB) Bytes in transfer cache freelist
MALLOC: + 35219240 ( 33.6 MiB) Bytes in thread cache freelists
MALLOC: + 601620480 ( 573.8 MiB) Bytes in malloc metadata
MALLOC: ------------
MALLOC: = 61624090624 (58769.3 MiB) Actual memory used (physical + swap)
MALLOC: + 66389303296 (63313.8 MiB) Bytes released to OS (aka unmapped)
MALLOC: ------------
MALLOC: = 128013393920 (122083.1 MiB) Virtual address space used
MALLOC:
MALLOC: 4879758 Spans in use
MALLOC: 24 Thread heaps in use
MALLOC: 8192 Tcmalloc page size
------------------------------------------------
Call ReleaseFreeMemory() to release freelist memory to the OS (via madvise()).
Bytes released to the OS take up virtual address space but no physical memory.
Updated by xianpao chen over 1 year ago
Venky Shankar wrote:
Have you tried running `heap release`?
yes,but it didn't seem to work.
Updated by Venky Shankar over 1 year ago
Do you have lots of small files and frequently scan them?
Updated by Venky Shankar over 1 year ago
BTW, are you not seeing any "oversized cache" warning for the MDS?
Updated by xianpao chen over 1 year ago
Venky Shankar wrote:
BTW, are you not seeing any "oversized cache" warning for the MDS?
there is no "oversized cache" warning , and my clients used by hadoop(hdfs), they should be big files. Each hadoop directory has about 5 million files.
Updated by Venky Shankar over 1 year ago
xianpao chen wrote:
Venky Shankar wrote:
Could you share the output of
[...]
Also, does running
[...]
reduce memory pressure?
I used to run heap release, but it didn't seem to work. I remount the directory of the clients and replace some kernel mounts with fuse, no exception has occurred in recent days.If the problem arises again, I will get heap stats.
I found the value of session_cache_liveness is so high, I'm not sure what it stands for, maybe the clients are under too much pressure.
That means the MDS is not recalling caps from client as fast as it should.
one of the clients session: {
"id": 2340609,
"entity": {
"name": {
"type": "client",
"num": 2340609
},
"addr": {
"type": "v1",
"addr": "172.20.147.32:0",
"nonce": 160998673
}
},
"state": "open",
"num_leases": 11,
"num_caps": 798820,
"request_load_avg": 2494,
"uptime": 231069.475750527,
"requests_in_flight": 1,
"num_completed_requests": 0,
"num_completed_flushes": 0,
"reconnecting": false,
"recall_caps": {
"value": 0,
"halflife": 60
},
"release_caps": {
"value": 654871.50554496993,
"halflife": 60
},
"recall_caps_throttle": {
"value": 0,
"halflife": 1.5
},
"recall_caps_throttle2o": {
"value": 0,
"halflife": 0.5
},
"session_cache_liveness": {
"value": 4549589.1180341952,
"halflife": 300
},
"cap_acquisition": {
"value": 3364.8737607100775,
"halflife": 10
},
"delegated_inos": [],
"inst": "client.2340609 v1:172.20.147.32:0/160998673",
"completed_requests": [],
"prealloc_inos": [ {
"start": "0x10005df656b",
"length": 63
}, {
"start": "0x10005df7168",
"length": 501
}
],
"client_metadata": {
"client_features": {
"feature_bits": "0x0000000000001bff"
},
"metric_spec": {
"metric_flags": {
"feature_bits": "0x"
}
},
"entity_id": "hdfs",
"hostname": "client01",
"kernel_version": "5.4.206-1.el7.elrepo.x86_64",
"root": "/hdfs"
}
},
How many client do you have? Can you share `client ls` details? You might just require some configuration adjustments for cap recalls.
Updated by xianpao chen over 1 year ago
- File sessions.log sessions.log added
Venky Shankar wrote:
xianpao chen wrote:
Venky Shankar wrote:
Could you share the output of
[...]
Also, does running
[...]
reduce memory pressure?
I used to run heap release, but it didn't seem to work. I remount the directory of the clients and replace some kernel mounts with fuse, no exception has occurred in recent days.If the problem arises again, I will get heap stats.
I found the value of session_cache_liveness is so high, I'm not sure what it stands for, maybe the clients are under too much pressure.
That means the MDS is not recalling caps from client as fast as it should.
one of the clients session: {
"id": 2340609,
"entity": {
"name": {
"type": "client",
"num": 2340609
},
"addr": {
"type": "v1",
"addr": "172.20.147.32:0",
"nonce": 160998673
}
},
"state": "open",
"num_leases": 11,
"num_caps": 798820,
"request_load_avg": 2494,
"uptime": 231069.475750527,
"requests_in_flight": 1,
"num_completed_requests": 0,
"num_completed_flushes": 0,
"reconnecting": false,
"recall_caps": {
"value": 0,
"halflife": 60
},
"release_caps": {
"value": 654871.50554496993,
"halflife": 60
},
"recall_caps_throttle": {
"value": 0,
"halflife": 1.5
},
"recall_caps_throttle2o": {
"value": 0,
"halflife": 0.5
},
"session_cache_liveness": {
"value": 4549589.1180341952,
"halflife": 300
},
"cap_acquisition": {
"value": 3364.8737607100775,
"halflife": 10
},
"delegated_inos": [],
"inst": "client.2340609 v1:172.20.147.32:0/160998673",
"completed_requests": [],
"prealloc_inos": [ {
"start": "0x10005df656b",
"length": 63
}, {
"start": "0x10005df7168",
"length": 501
}
],
"client_metadata": {
"client_features": {
"feature_bits": "0x0000000000001bff"
},
"metric_spec": {
"metric_flags": {
"feature_bits": "0x"
}
},
"entity_id": "hdfs",
"hostname": "client01",
"kernel_version": "5.4.206-1.el7.elrepo.x86_64",
"root": "/hdfs"
}
},How many client do you have? Can you share `client ls` details? You might just require some configuration adjustments for cap recalls.
62 clients.I remember this attachment(sessions.log) was queried when the problem occurred.
Updated by Venky Shankar over 1 year ago
Hey,
Thanks for the update. You should try adjusting `mds_session_cache_liveness_decay_rate` to a lower value (default: 300s). Try lowering it in steps of 50 or 100 and check if situation improved (lowering this config will make the MDS react quicker to recall caps). Also, you may want to tune `mds_max_caps_per_client` to a lower value. This is 1M by default. The down side of lowering this would be that clients would hold lesser number of caps which could effect the workload.
I'd play with `mds_session_cache_liveness_decay_rate` first and see if things improve. Please let us know the results.
Updated by Venky Shankar over 1 year ago
Did you get to applying the suggested config?
Updated by xianpao chen over 1 year ago
Venky Shankar wrote:
Did you get to applying the suggested config?
Thanks for your suggestion, I will try it tongint because the company requires, I will get back to you in the next two days, I'm sorry to keep you waiting.
Updated by xianpao chen over 1 year ago
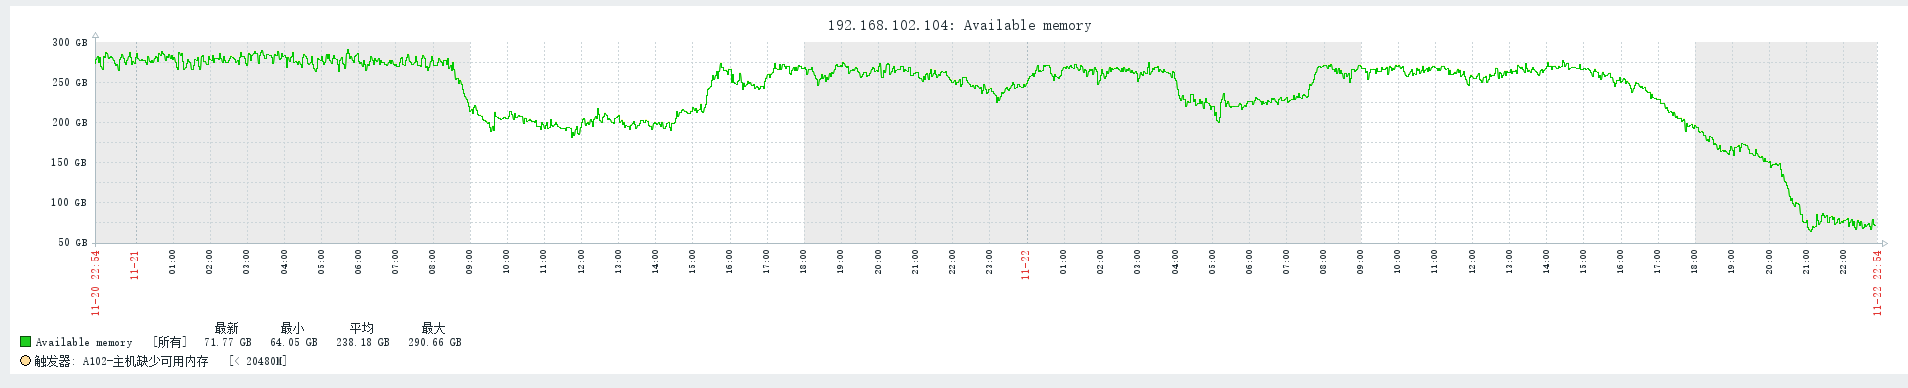
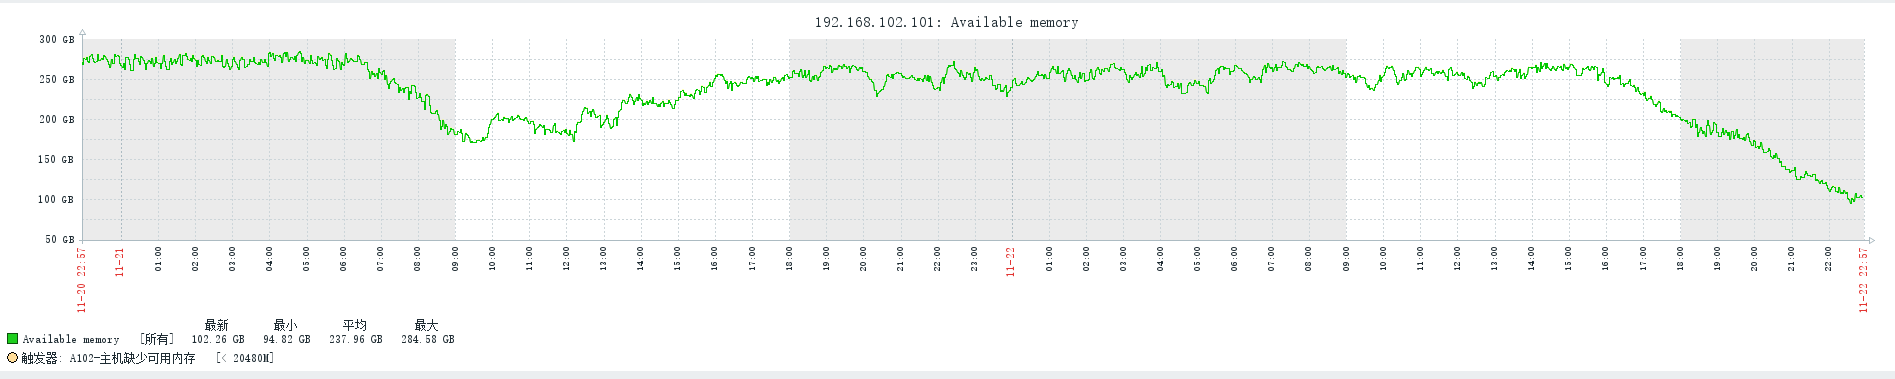
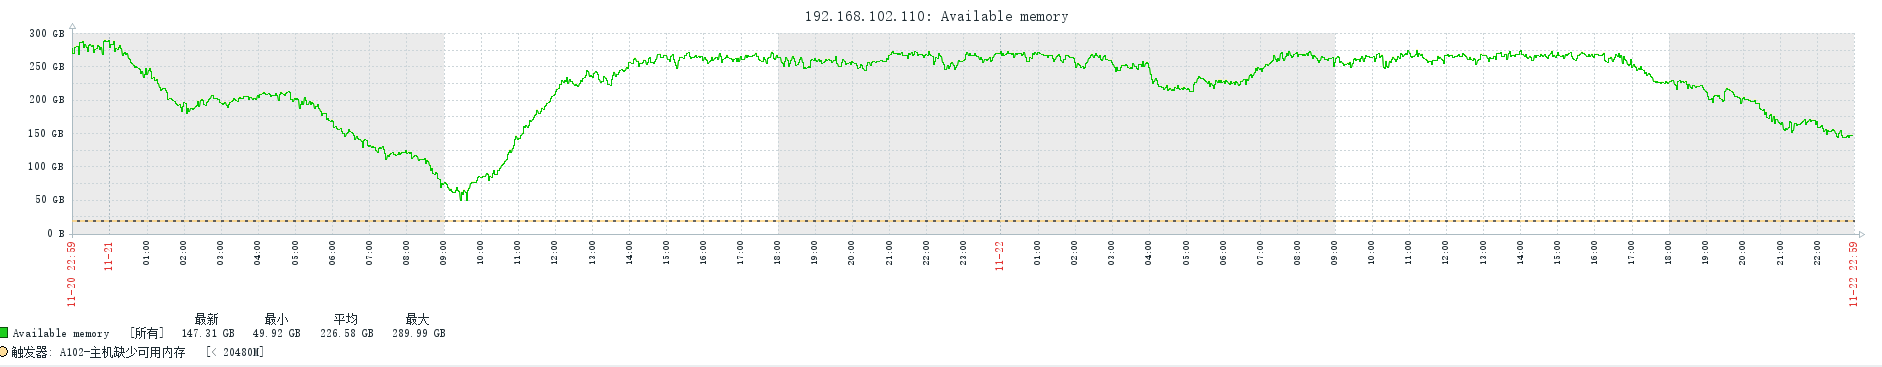
- File memory1.png memory1.png added
- File memory2.png memory2.png added
- File memory3.png memory3.png added
- File 172.26.11.147_2022-11-22_23_34_13-clients_for_track.log 172.26.11.147_2022-11-22_23_34_13-clients_for_track.log added
I happened to have a memory problem today, then I changed mds_session_cache_liveness_decay_rate to 150s, tried "ceph tell mds.<> heap release" , and wait for 1.5 hours, the memory still could not be released.
I changed mds_max_caps_per_client to 917504 when mds_session_cache_liveness_decay_rate didn't work, it didn't work either. Memory used by application can not be release in time.
the log:
root@HY-D01-S203-C19-POD4-CEPH-FS-01:~# ceph fs status
cephfs - 51 clients
======
RANK STATE MDS ACTIVITY DNS INOS DIRS CAPS
0 active cephfs.HY-D01-S203-D03-POD4-CEPH-FS-10.yemgde Reqs: 150 /s 5677k 5677k 9321 3923k
1 active cephfs.HY-D01-S203-D01-POD4-CEPH-FS-04.wtsyvt Reqs: 723 /s 5720k 5720k 3789 3772k
2 active cephfs.HY-D01-S203-C19-POD4-CEPH-FS-01.clgetg Reqs: 91 /s 5893k 5893k 2328 2460k
1-s standby-replay cephfs.HY-D01-S203-D03-POD4-CEPH-FS-09.bmlqxn Evts: 23 /s 4347k 4345k 2638 0
2-s standby-replay cephfs.HY-D01-S203-D01-POD4-CEPH-FS-05.qacnfw Evts: 37 /s 1137k 1137k 621 0
0-s standby-replay cephfs.HY-D01-S203-D02-POD4-CEPH-FS-08.asiflv Evts: 75 /s 7302k 7301k 10.6k 0
POOL TYPE USED AVAIL
cephfs.cephfs.meta metadata 84.7G 368T
cephfs.cephfs.data data 471T 368T
MDS version: ceph version 16.2.7 (dd0603118f56ab514f133c8d2e3adfc983942503) pacific (stable)
root@HY-D01-S203-C19-POD4-CEPH-FS-01:~#
root@HY-D01-S203-D01-POD4-CEPH-FS-04:/# ceph tell mds.1 heap stats
2022-11-22T14:33:42.531+0000 7f95777fe700 0 client.2601247 ms_handle_reset on v2:172.20.134.104:6800/491609537
2022-11-22T14:33:42.555+0000 7f95777fe700 0 client.2597661 ms_handle_reset on v2:172.20.134.104:6800/491609537
mds.cephfs.HY-D01-S203-D01-POD4-CEPH-FS-04.wtsyvt tcmalloc heap stats:------------------------------------------------
MALLOC: 243992863624 (232689.7 MiB) Bytes in use by application
MALLOC: + 135798784 ( 129.5 MiB) Bytes in page heap freelist
MALLOC: + 2435303056 ( 2322.5 MiB) Bytes in central cache freelist
MALLOC: + 4926976 ( 4.7 MiB) Bytes in transfer cache freelist
MALLOC: + 37742568 ( 36.0 MiB) Bytes in thread cache freelists
MALLOC: + 1140326400 ( 1087.5 MiB) Bytes in malloc metadata
MALLOC: ------------
MALLOC: = 247746961408 (236269.9 MiB) Actual memory used (physical + swap)
MALLOC: + 0 ( 0.0 MiB) Bytes released to OS (aka unmapped)
MALLOC: ------------
MALLOC: = 247746961408 (236269.9 MiB) Virtual address space used
MALLOC:
MALLOC: 17390375 Spans in use
MALLOC: 24 Thread heaps in use
MALLOC: 8192 Tcmalloc page size
------------------------------------------------
Call ReleaseFreeMemory() to release freelist memory to the OS (via madvise()).
Bytes released to the OS take up virtual address space but no physical memory.
root@HY-D01-S203-D01-POD4-CEPH-FS-04:/#
root@HY-D01-S203-C19-POD4-CEPH-FS-01:~# ceph tell mds.0 heap stats
2022-11-22T22:36:53.654+0800 7fd78f7fe700 0 client.2632525 ms_handle_reset on v2:172.20.134.110:6800/2694018948
2022-11-22T22:36:53.686+0800 7fd78f7fe700 0 client.2575694 ms_handle_reset on v2:172.20.134.110:6800/2694018948
mds.cephfs.HY-D01-S203-D03-POD4-CEPH-FS-10.yemgde tcmalloc heap stats:------------------------------------------------
MALLOC: 147456759584 (140625.7 MiB) Bytes in use by application
MALLOC: + 54689792 ( 52.2 MiB) Bytes in page heap freelist
MALLOC: + 2480484048 ( 2365.6 MiB) Bytes in central cache freelist
MALLOC: + 559104 ( 0.5 MiB) Bytes in transfer cache freelist
MALLOC: + 15192592 ( 14.5 MiB) Bytes in thread cache freelists
MALLOC: + 1200226304 ( 1144.6 MiB) Bytes in malloc metadata
MALLOC: ------------
MALLOC: = 151207911424 (144203.1 MiB) Actual memory used (physical + swap)
MALLOC: + 107722031104 (102731.7 MiB) Bytes released to OS (aka unmapped)
MALLOC: ------------
MALLOC: = 258929942528 (246934.8 MiB) Virtual address space used
MALLOC:
MALLOC: 10926623 Spans in use
MALLOC: 25 Thread heaps in use
MALLOC: 8192 Tcmalloc page size
------------------------------------------------
Call ReleaseFreeMemory() to release freelist memory to the OS (via madvise()).
Bytes released to the OS take up virtual address space but no physical memory.
root@HY-D01-S203-C19-POD4-CEPH-FS-01:~# ceph tell mds.2 heap stats
2022-11-22T22:38:42.986+0800 7fe7aaffd700 0 client.2632550 ms_handle_reset on v2:172.20.134.101:6800/64357427
2022-11-22T22:38:43.006+0800 7fe7aaffd700 0 client.2632560 ms_handle_reset on v2:172.20.134.101:6800/64357427
mds.cephfs.HY-D01-S203-C19-POD4-CEPH-FS-01.clgetg tcmalloc heap stats:------------------------------------------------
MALLOC: 194508031208 (185497.3 MiB) Bytes in use by application
MALLOC: + 450666496 ( 429.8 MiB) Bytes in page heap freelist
MALLOC: + 2380818576 ( 2270.5 MiB) Bytes in central cache freelist
MALLOC: + 5830912 ( 5.6 MiB) Bytes in transfer cache freelist
MALLOC: + 37747080 ( 36.0 MiB) Bytes in thread cache freelists
MALLOC: + 948830208 ( 904.9 MiB) Bytes in malloc metadata
MALLOC: ------------
MALLOC: = 198331924480 (189144.1 MiB) Actual memory used (physical + swap)
MALLOC: + 6867501056 ( 6549.4 MiB) Bytes released to OS (aka unmapped)
MALLOC: ------------
MALLOC: = 205199425536 (195693.4 MiB) Virtual address space used
MALLOC:
MALLOC: 14173848 Spans in use
MALLOC: 24 Thread heaps in use
MALLOC: 8192 Tcmalloc page size
------------------------------------------------
Call ReleaseFreeMemory() to release freelist memory to the OS (via madvise()).
Bytes released to the OS take up virtual address space but no physical memory.
Updated by Venky Shankar over 1 year ago
I checked the session info, there is just one client which is holding ~1M caps. But that should not bother the MDS the way you experience. Maybe the MDS is not trimming its cache fast enough. Could you try running
ceph tell mds.<> cache dropto see if the situations improves?
How much memory does the MDS nodes have?
Updated by Venky Shankar over 1 year ago
BTW, do you see any performance degradation on clients in general over the course and/or when the MDS is about to get OOM killed?
Updated by xianpao chen over 1 year ago
the "free -h" of the mds node(after restart the mds):
total        used        free      shared  buff/cache   available
Mem:          376Gi        86Gi        52Gi       6.0Mi       236Gi       286Gi
Swap:         8.0Gi       4.6Gi       3.4Gi
I will try "cache drop" next time, and observe the performance of the client.
Updated by Venky Shankar over 1 year ago
Any reason you are using mds_cache_memory_limit = 16GB when you have memory to spare?
Updated by xianpao chen over 1 year ago
I've heard that too large mds_cache_memory_limit may cause problems, so I use mds_cache_memory_limit = 16GB, no special purpose.
Any better suggestions for the number of mds_cache_memory_limit?
Updated by Venky Shankar over 1 year ago
xianpao chen wrote:
I've heard that too large mds_cache_memory_limit may cause problems, so I use mds_cache_memory_limit = 16GB, no special purpose.
Any better suggestions for the number of mds_cache_memory_limit?
Unless you are running into frequent "cache oversized" MDS warnings, there is no need to bump it up.
There are reports of unbounded buffer_anon growth in nautilus, but AFAICT, nothing in pacific.
Updated by xianpao chen over 1 year ago
Is there a good way to monitor the read/write speed of the fuse and kernel client?
Updated by Venky Shankar over 1 year ago
xianpao chen wrote:
Is there a good way to monitor the read/write speed of the fuse and kernel client?
Is this relevant to this ticket? Please create a separate tracker for this (and yes, there is a way in recent releases).
Updated by xianpao chen over 1 year ago
Now it's an occasional problem, and I'm watching to see if it happens again. I'm not sure what the trigger condition is yet, but it's probably a client problem. You asked before whether the performance of the client will decrease when problems occur, but I found that there is no good way to observe the performance data of the client. How to observe the read and write data of the client has puzzled me for a long time.
Updated by Dan van der Ster about 2 months ago
Updated by Venky Shankar about 1 month ago
Dan van der Ster wrote:
There was a similar case back in nautilus:
Correct - I mentioned that in note-22 and the patch controlled the memory consumption. Now, that we have this report (and another similar case) in pacific, it's likely that there are similar fallouts.