Bug #57341
opencephadm: failures from tests comparing output strings are difficult to debug
0%
Description
When unit tests for the orchestrator/cephadm modules compare strings of things like config files or command output that are generated and there is a slight difference, the failure printed does not make it particularly easy to tell how the output differs.
For example, this is a test failure where an alertmanager config differs because one uses "localhost" and the other uses "localhost.localdomain" for an address. This is not immediately obvious from the failure message and you'd ave to parse through the output or generate a diff of the two strings to find out. Especially when this is just being printed to your terminal.
self = <cephadm.tests.test_services.TestMonitoring object at 0x7fb674203bd0>, mock_get = <MagicMock name='get' id='140400352654480'>, _run_cephadm = <MagicMock name='_run_cephadm' id='140400352671824'>
cephadm_module = <cephadm.module.CephadmOrchestrator object at 0x7fb1872fb590>

    @patch("cephadm.serve.CephadmServe._run_cephadm")
    @patch("mgr_module.MgrModule.get")
    def test_alertmanager_config(self, mock_get, _run_cephadm,
                                 cephadm_module: CephadmOrchestrator):
        _run_cephadm.side_effect = async_side_effect(('{}', '', 0))
        mock_get.return_value = {"services": {"dashboard": "http://[::1]:8080"}}

        with with_host(cephadm_module, 'test'):
            with with_service(cephadm_module, AlertManagerSpec()):
                y = dedent(self._get_config('http://localhost:8080')).lstrip()
                _run_cephadm.assert_called_with(
                    'test',
                    'alertmanager.test',
                    'deploy',
                    [
                        '--name', 'alertmanager.test',
                        '--meta-json', '{"service_name": "alertmanager", "ports": [9093, 9094], "ip": null, "deployed_by": [], "rank": null, "rank_generation": null, "extra_container_args": null}',
                        '--config-json', '-', '--tcp-ports', '9093 9094'
                    ],
                    stdin=json.dumps({"files": {"alertmanager.yml": y}, "peers": []}),
>                   image='')

cephadm/tests/test_services.py:290:
_ _ _ _ _ _ _ _ _ _ _ _ _ _ _ _ _ _ _ _ _ _ _ _ _ _ _ _ _ _ _ _ _ _ _ _ _ _ _ _ _ _ _ _ _ _ _ _ _ _ _ _ _ _ _ _ _ _ _ _ _ _ _ _ _ _ _ _ _ _ _ _ _ _ _ _ _ _ _ _ _ _ _ _ _ _ _ _ _ _ _ _ _ _ _ _ _ _ _ _ _ _ _ _ _ _ _ _ _ _

_mock_self = <MagicMock name='_run_cephadm' id='140400352671824'>
args = ('test', 'alertmanager.test', 'deploy', ['--name', 'alertmanager.test', '--meta-json', '{"service_name": "alertmanager..., "deployed_by": [], "rank": null, "rank_generation": null, "extra_container_args": null}', '--config-json', '-', ...])
kwargs = {'image': '', 'stdin': '{"files": {"alertmanager.yml": "# This file is generated by cephadm.\\n# See https://prometheu...ceph-dashboard\'\\n  webhook_configs:\\n  - url: \'http://localhost:8080/api/prometheus_receiver\'\\n"}, "peers": []}'}
expected = (('test', 'alertmanager.test', 'deploy', ['--name', 'alertmanager.test', '--meta-json', '{"service_name": "alertmanage...eph-dashboard\'\\n  webhook_configs:\\n  - url: \'http://localhost:8080/api/prometheus_receiver\'\\n"}, "peers": []}'})
_error_message = <function NonCallableMock.assert_called_with.<locals>._error_message at 0x7fb598239f80>
actual = call('test', 'alertmanager.test', 'deploy', ['--name', 'alertmanager.test', '--meta-json', '{"service_name": "alertman...rd\'\\n  webhook_configs:\\n  - url: \'http://localhost.localdomain:8080/api/prometheus_receiver\'\\n"}, "peers": []}')
cause = None

    def assert_called_with(_mock_self, *args, **kwargs):
        """assert that the mock was called with the specified arguments.

        Raises an AssertionError if the args and keyword args passed in are
        different to the last call to the mock."""
        self = _mock_self
        if self.call_args is None:
            expected = self._format_mock_call_signature(args, kwargs)
            raise AssertionError('Expected call: %s\nNot called' % (expected,))

        def _error_message():
            msg = self._format_mock_failure_message(args, kwargs)
            return msg
        expected = self._call_matcher((args, kwargs))
        actual = self._call_matcher(self.call_args)
        if expected != actual:
            cause = expected if isinstance(expected, Exception) else None
>           raise AssertionError(_error_message()) from cause
E           AssertionError: Expected call: _run_cephadm('test', 'alertmanager.test', 'deploy', ['--name', 'alertmanager.test', '--meta-json', '{"service_name": "alertmanager", "ports": [9093, 9094], "ip": null, "deployed_by": [], "rank": null, "rank_generation": null, "extra_container_args": null}', '--config-json', '-', '--tcp-ports', '9093 9094'], image='', stdin='{"files": {"alertmanager.yml": "# This file is generated by cephadm.\\n# See https://prometheus.io/docs/alerting/configuration/ for documentation.\\n\\nglobal:\\n  resolve_timeout: 5m\\n  http_config:\\n    tls_config:\\n      insecure_skip_verify: true\\n\\nroute:\\n  receiver: \'default\'\\n  routes:\\n    - group_by: [\'alertname\']\\n      group_wait: 10s\\n      group_interval: 10s\\n      repeat_interval: 1h\\n      receiver: \'ceph-dashboard\'\\n\\nreceivers:\\n- name: \'default\'\\n  webhook_configs:\\n- name: \'ceph-dashboard\'\\n  webhook_configs:\\n  - url: \'http://localhost:8080/api/prometheus_receiver\'\\n"}, "peers": []}')
E           Actual call: _run_cephadm('test', 'alertmanager.test', 'deploy', ['--name', 'alertmanager.test', '--meta-json', '{"service_name": "alertmanager", "ports": [9093, 9094], "ip": null, "deployed_by": [], "rank": null, "rank_generation": null, "extra_container_args": null}', '--config-json', '-', '--tcp-ports', '9093 9094'], image='', stdin='{"files": {"alertmanager.yml": "# This file is generated by cephadm.\\n# See https://prometheus.io/docs/alerting/configuration/ for documentation.\\n\\nglobal:\\n  resolve_timeout: 5m\\n  http_config:\\n    tls_config:\\n      insecure_skip_verify: true\\n\\nroute:\\n  receiver: \'default\'\\n  routes:\\n    - group_by: [\'alertname\']\\n      group_wait: 10s\\n      group_interval: 10s\\n      repeat_interval: 1h\\n      receiver: \'ceph-dashboard\'\\n\\nreceivers:\\n- name: \'default\'\\n  webhook_configs:\\n- name: \'ceph-dashboard\'\\n  webhook_configs:\\n  - url: \'http://localhost.localdomain:8080/api/prometheus_receiver\'\\n"}, "peers": []}')
Files
Updated by John Mulligan over 1 year ago
I did a few minutes of research and found two packages that may help:
pytest-mock (https://pytest-mock.readthedocs.io/en/latest/) if we replace some of the existing mock usages with this fixture, it can do more pytest introspection of the arguments to the assertion
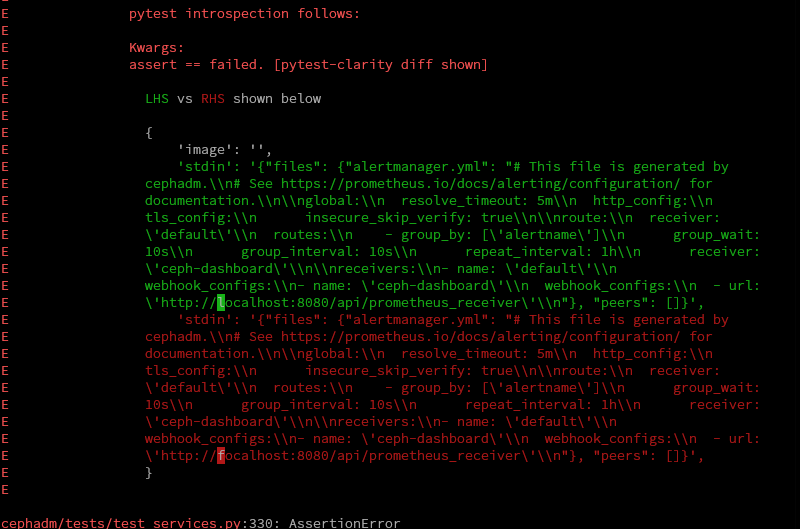
In addition pytest-clarity (https://pypi.org/project/pytest-clarity/) can help highlight the exact differing characters.
E               assert == failed. [pytest-clarity diff shown]
E
E                 LHS vs RHS shown below
E
E                 {
E                     'image': '',
E                     'stdin': '{"files": {"alertmanager.yml": "# This file is generated by
E                 cephadm.\\n# See https://prometheus.io/docs/alerting/configuration/ for
E                 documentation.\\n\\nglobal:\\n  resolve_timeout: 5m\\n  http_config:\\n
E                 tls_config:\\n      insecure_skip_verify: true\\n\\nroute:\\n  receiver:
E                 \'default\'\\n  routes:\\n    - group_by: [\'alertname\']\\n      group_wait:
E                 10s\\n      group_interval: 10s\\n      repeat_interval: 1h\\n      receiver:
E                 \'ceph-dashboard\'\\n\\nreceivers:\\n- name: \'default\'\\n
E                 webhook_configs:\\n- name: \'ceph-dashboard\'\\n  webhook_configs:\\n  - url:
E                 \'http://localhost:8080/api/prometheus_receiver\'\\n"}, "peers": []}',
E                     'stdin': '{"files": {"alertmanager.yml": "# This file is generated by
E                 cephadm.\\n# See https://prometheus.io/docs/alerting/configuration/ for
E                 documentation.\\n\\nglobal:\\n  resolve_timeout: 5m\\n  http_config:\\n
E                 tls_config:\\n      insecure_skip_verify: true\\n\\nroute:\\n  receiver:
E                 \'default\'\\n  routes:\\n    - group_by: [\'alertname\']\\n      group_wait:
E                 10s\\n      group_interval: 10s\\n      repeat_interval: 1h\\n      receiver:
E                 \'ceph-dashboard\'\\n\\nreceivers:\\n- name: \'default\'\\n
E                 webhook_configs:\\n- name: \'ceph-dashboard\'\\n  webhook_configs:\\n  - url:
E                 \'http://focalhost:8080/api/prometheus_receiver\'\\n"}, "peers": []}',
E                 }
E
Updated by John Mulligan over 1 year ago
See attached screenshot for a better colorized example.