Bug #56707
closedpglog growing unbounded on EC with copy by ref
100%
Description
How to reproduce
- create a 10GB object in bucket1 using multipart upload
- copy object 200x via s3:ObjectCopy in parallel
Tested on Pacific 16.2.9
Observation
- rep 3x: PG log byte increase. 0.03GiB over 123 OSDs active data OSDs
- ec 4:2: PG log byte increase. 8GiB over 96 OSDs active data OSDs
Looking at the pglog itself, the log was up to 10KB and dumping the refcount xattr we see the following:
# ceph-dencoder type obj_refcount import /etc/ceph/out decode dump_json
{
    "refs": [
        {
            "oid": "<redacted>.5026683301901118227",
            "active": true
        }
    ],
    "retired_refs": [
        // list of 200 refs
    ]
}
Even after deleting + gc'ing the copied objects, the original still has the full list in `retired_refs` which weights a lot and will only increase the pglog size over time with EC due to the look-aside object.
Symptoms
This can cause the nodes to run ouf of memory but also will cause the memtables to get full very quickly on the data OSDs causing IO stalls and a lot of compaction. For some OSDs we even reached L5 which is a long term performance issue.
Files
Updated by Neha Ojha over 1 year ago
- Assignee set to Nitzan Mordechai
Can you dump the pg log using the ceph-objectstore-tool when the OSD is consuming high memory and share it with us?
Updated by Alexandre Marangone over 1 year ago
- File pglog.tar.bz2 pglog.tar.bz2 added
Attached a pglog at the peak of one prod issue. I had to redact the object names since it's prod but let me know if you need them and I can easily reproduce this in our staging environment.
Updated by Nitzan Mordechai over 1 year ago
Alexandre, can you please send us the dump_mempools and if you can also run valgrind massif ?
Updated by Alexandre Marangone over 1 year ago
I don't have one handy everything is in prometheus and sharing a screen of all the mempools isn't very legible. Valgrind is going to be a bit tricky since we're using containers so I'll have to work around this, I'll get you the data later today or tomorrow
Updated by Alexandre Marangone over 1 year ago
- File massif.out.bz2 massif.out.bz2 added
- File mempool_before_and_after.txt mempool_before_and_after.txt added
That was faster than I thought. Attached massif outfile (let me know if that's what you expect not super familiar with valgrind) and mempools before/after.
Note that valgrind slowed the OSD down to a crawl so s3cmd objectcopy timed out/failed in most instances.
Workload sent:
- s3 objectcopy of 1x 10GB file from bucket1 to bucket2 - 500 times in parallel
- osd.32 is OSD I monitored. It appears to only have one part.
Edit: Even though s3cmd timed out, the workload actually finished in the bg. Updated after mempool below:
# ceph daemon osd.32 dump_mempools
{
"mempool": {
"by_pool": {
"bloom_filter": {
"items": 0,
"bytes": 0
},
"bluestore_alloc": {
"items": 15523110,
"bytes": 182819808
},
"bluestore_cache_data": {
"items": 6509,
"bytes": 1391216
},
"bluestore_cache_onode": {
"items": 6706,
"bytes": 4130896
},
"bluestore_cache_meta": {
"items": 1742472,
"bytes": 11319642
},
"bluestore_cache_other": {
"items": 23988,
"bytes": 581688
},
"bluestore_Buffer": {
"items": 133,
"bytes": 12768
},
"bluestore_Extent": {
"items": 9858,
"bytes": 473184
},
"bluestore_Blob": {
"items": 9858,
"bytes": 1025232
},
"bluestore_SharedBlob": {
"items": 9858,
"bytes": 1104096
},
"bluestore_inline_bl": {
"items": 75,
"bytes": 13588
},
"bluestore_fsck": {
"items": 0,
"bytes": 0
},
"bluestore_txc": {
"items": 1,
"bytes": 784
},
"bluestore_writing_deferred": {
"items": 7,
"bytes": 28288
},
"bluestore_writing": {
"items": 64,
"bytes": 927056
},
"bluefs": {
"items": 191935,
"bytes": 2578592
},
"bluefs_file_reader": {
"items": 1038,
"bytes": 132864
},
"bluefs_file_writer": {
"items": 3,
"bytes": 576
},
"buffer_anon": {
"items": 2204,
"bytes": 4591510
},
"buffer_meta": {
"items": 39234,
"bytes": 3452592
},
"osd": {
"items": 256,
"bytes": 2895872
},
"osd_mapbl": {
"items": 0,
"bytes": 0
},
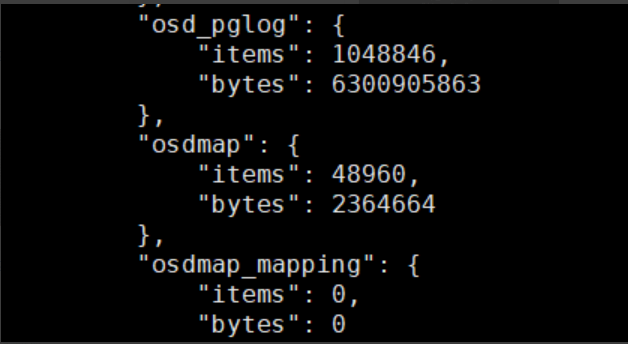
"osd_pglog": {
"items": 1111350,
"bytes": 1193066303
},
"osdmap": {
"items": 47045,
"bytes": 1842072
},
"osdmap_mapping": {
"items": 0,
"bytes": 0
},
"pgmap": {
"items": 0,
"bytes": 0
},
"mds_co": {
"items": 0,
"bytes": 0
},
"unittest_1": {
"items": 0,
"bytes": 0
},
"unittest_2": {
"items": 0,
"bytes": 0
}
},
"total": {
"items": 18725704,
"bytes": 1412388627
}
}
}
Updated by Nitzan Mordechai over 1 year ago
Alex
few more question, so i'll be able to recreate the scenario as you got it
1. "dumping the refcount" - how did you dump the refcount?
2. "ec 4:2: PG log byte increase. 8GiB over 96 OSDs active data OSDs" - how did you measure the 8gb ?
From the massif i can see that pg log is using some of the memory, but rocksdb as well, i was not able to recreate that situation yet, if you can answer those question, i'll re-try it
Updated by Alexandre Marangone over 1 year ago
1. "dumping the refcount" - how did you dump the refcount?
I extracted it with rados getxattr refcont and used the ceph-dencoder with type obj_refcount
2. "ec 4:2: PG log byte increase. 8GiB over 96 OSDs active data OSDs" - how did you measure the 8gb ?
We've a prometheus exporter that queries OSDs asok every 2 mins including mempools. I summed all the data from all OSDs
For repro, I used MPU in order to make sure that I'd have objets in different OSDs so that I wouldn't have to map the objects to specific OSDs.
On a side note since I mentioned Pacific, these OSDs were upgraded from Nautilus but we haven't resharded rocksdb although I don't believe this will help. I could try on a resharded rocksdb but that'd take me a bit of time to set up.
Updated by Nitzan Mordechai over 1 year ago
Alex, thanks for the information. Unfortunately, I couldn't recreate the issue, but I did found some issue with refcound and EC pools, I created PR with the fix. Is there any chance you can help us verify it?
Updated by Nitzan Mordechai over 1 year ago
- Status changed from New to Fix Under Review
Updated by Alexandre Marangone over 1 year ago
That is very strange. I've been able to reproduce 100% of the time with this:
$ s3cmd mb s3://alex-mp1
$ s3cmd mb s3://alex-mp2
$ s3cmd put 10gbfile s3://alex-mp1/file
$ for i in {0..199}; s3cmd cp s3://alex-mp1/file s3://alex-mp2/file$i & done
Thanks for the patch, I'll give it a try, I'm going to be fairly busy for the next couple of days but I'll report back by Monday evening at the latest
Updated by Alexandre Marangone over 1 year ago
I was able to try the patch on Pacific this morning. Running one OSD with the patch, getting 500s from RGW when I presumably hit that OSD. Only tried MPUs and objectcopy. Once I reverted the patch no 500s
Updated by Nitzan Mordechai over 1 year ago
Alex, can you share logs of the osd that caused the 500s? my theory is peering un-match pglog since one osd (with the patch) have mismatched pglog with the other osd's
Updated by Alexandre Marangone over 1 year ago
I won't be able to rerun the patched branch until Monday. Haven't you been able to reproduce it? Feels trivial to so I'm worried that I've some other thing going on if reproducing is impossible for you. I'll try a vstart from that branch directly to remove that var on monday
Updated by Alexandre Marangone over 1 year ago
- File ceph-osd.32.log.bz2 ceph-osd.32.log.bz2 added
Attached the debug_osd 20 logs for one the OSD. I turned off (deep)scrub cause the logs were spammed with scrub errors which I'm guessing is related to the patch as well
Updated by Nitzan Mordechai over 1 year ago
Alexandre Marangone wrote:
Attached the debug_osd 20 logs for one the OSD. I turned off (deep)scrub cause the logs were spammed with scrub errors which I'm guessing is related to the patch as well
We need the patch on all OSDs, the pglog is different - so peering start and scrub.
Updated by Yuri Weinstein about 1 year ago
Updated by Radoslaw Zarzynski about 1 year ago
- Status changed from Fix Under Review to Pending Backport
- Backport set to pacific,quincy
Updated by Backport Bot about 1 year ago
- Copied to Backport #58613: pacific: pglog growing unbounded on EC with copy by ref added
Updated by Backport Bot about 1 year ago
- Copied to Backport #58614: quincy: pglog growing unbounded on EC with copy by ref added
Updated by 王子敬 wang 11 months ago
- File 1683775204857.png 1683775204857.png added
- File 1683775808540.jpg 1683775808540.jpg added
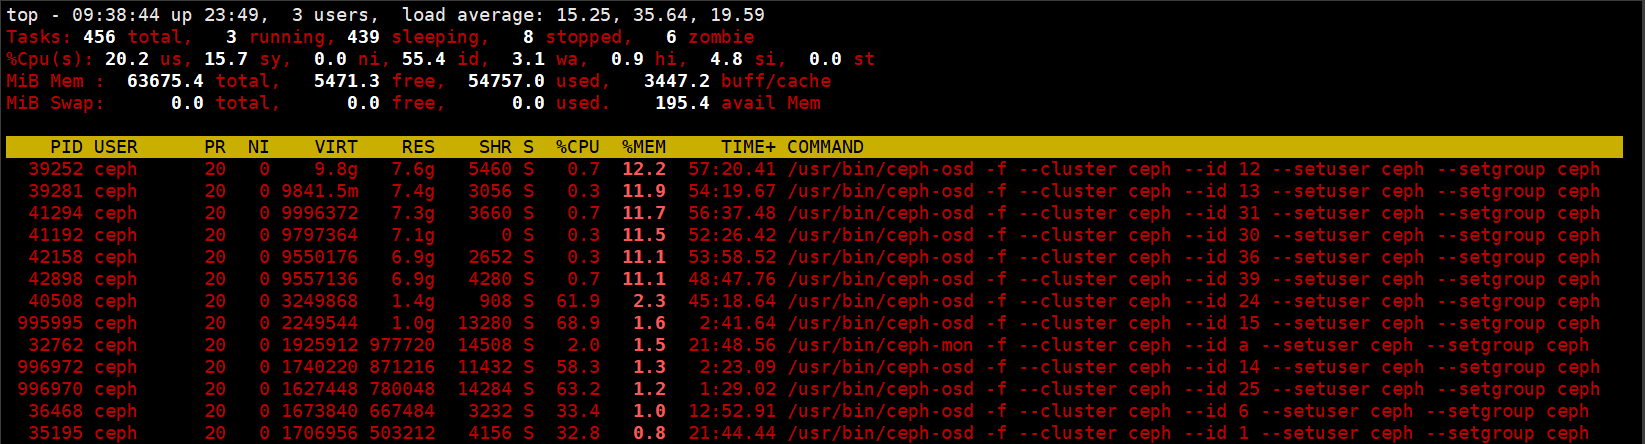
I have also experienced this situation here
- Create 30 objects in bucket1 using put
- Using 30 objects as the source, append write 1K for the 30 objects and copy to the bucket1,Perform hundreds of cycles like this
- append write use boto url, copy use boto3:copy_object
- one pglog entry size reaches 5kB
cause the nodes to run ouf of memory
Tested on 15.2.13
Updated by 王子敬 wang 11 months ago
王子敬 wang wrote:
I have also experienced this situation here
- Create 30 objects in bucket1 using put
- Using 30 objects as the source, append write 1K for the 30 objects and copy to the bucket1,Perform hundreds of cycles like this
- append write use boto url, copy use boto3:copy_object- one pglog entry size reaches 5kB
cause the nodes to run ouf of memoryTested on 15.2.13
I suspect it is caused by an overly large attr, as the attr <attr_name, attr_value> also be present in the pglog,cause the osd to run ouf of memory.
Updated by Nitzan Mordechai 11 months ago
王子敬 wang wrote:
王子敬 wang wrote:
I have also experienced this situation here
- Create 30 objects in bucket1 using put
- Using 30 objects as the source, append write 1K for the 30 objects and copy to the bucket1,Perform hundreds of cycles like this
- append write use boto url, copy use boto3:copy_object- one pglog entry size reaches 5kB
cause the nodes to run ouf of memoryTested on 15.2.13
I suspect it is caused by an overly large attr, as the attr <attr_name, attr_value> also be present in the pglog,cause the osd to run ouf of memory.
Are you still getting that behavior with fix that suggested in the PR ?
Updated by Alexandre Marangone 9 months ago
Sorry this fell of my radar... We tested the Pacific backport for it and the pglog byte growth is similar
Updated by Konstantin Shalygin 3 months ago
- Status changed from Pending Backport to Resolved
- % Done changed from 0 to 100
- Source set to Community (dev)