Bug #56456
openrook-ceph-v1.9.5: ceph-osd crash randomly
0%
Description
Hi,
after a migration to rook-ceph v1.9.5, ceph osd crash :
sh-4.4$ ceph crash info 2022-07-04T09:38:35.887100Z_895047ab-c7a4-4162-ba1c-463dd6f88647
{
    "assert_condition": "abort",
    "assert_file": "/home/jenkins-build/build/workspace/ceph-build/ARCH/x86_64/AVAILABLE_ARCH/x86_64/AVAILABLE_DIST/centos8/DIST/centos8/MACHINE_SIZE/gigantic/release/16.2.9/rpm/el8/BUILD/ceph-16.2.9/src/os/bluestore/bluestore_types.cc",
    "assert_func": "void bluestore_extent_ref_map_t::put(uint64_t, uint32_t, PExtentVector*, bool*)",
    "assert_line": 210,
    "assert_msg": "/home/jenkins-build/build/workspace/ceph-build/ARCH/x86_64/AVAILABLE_ARCH/x86_64/AVAILABLE_DIST/centos8/DIST/centos8/MACHINE_SIZE/gigantic/release/16.2.9/rpm/el8/BUILD/ceph-16.2.9/src/os/bluestore/bluestore_types.cc: In function 'void bluestore_extent_ref_map_t::put(uint64_t, uint32_t, PExtentVector*, bool*)' thread 7fb0dfb59700 time 2022-07-04T09:38:35.866896+0000\n/home/jenkins-build/build/workspace/ceph-build/ARCH/x86_64/AVAILABLE_ARCH/x86_64/AVAILABLE_DIST/centos8/DIST/centos8/MACHINE_SIZE/gigantic/release/16.2.9/rpm/el8/BUILD/ceph-16.2.9/src/os/bluestore/bluestore_types.cc: 210: ceph_abort_msg(\"put on missing extent (nothing before)\")\n",
    "assert_thread_name": "tp_osd_tp",
    "backtrace": [
        "/lib64/libpthread.so.0(+0x12ce0) [0x7fb103458ce0]",
        "gsignal()",
        "abort()",
        "(ceph::__ceph_abort(char const*, int, char const*, std::__cxx11::basic_string<char, std::char_traits<char>, std::allocator<char> > const&)+0x1b6) [0x5564b6d7ff6d]",
        "(bluestore_extent_ref_map_t::put(unsigned long, unsigned int, std::vector<bluestore_pextent_t, mempool::pool_allocator<(mempool::pool_index_t)5, bluestore_pextent_t> >*, bool*)+0x41f) [0x5564b7422adf]",
        "(BlueStore::_wctx_finish(BlueStore::TransContext*, boost::intrusive_ptr<BlueStore::Collection>&, boost::intrusive_ptr<BlueStore::Onode>, BlueStore::WriteContext*, std::set<BlueStore::SharedBlob*, std::less<BlueStore::SharedBlob*>, std::allocator<BlueStore::SharedBlob*> >*)+0xf5b) [0x5564b73af6cb]",
        "(BlueStore::_do_truncate(BlueStore::TransContext*, boost::intrusive_ptr<BlueStore::Collection>&, boost::intrusive_ptr<BlueStore::Onode>, unsigned long, std::set<BlueStore::SharedBlob*, std::less<BlueStore::SharedBlob*>, std::allocator<BlueStore::SharedBlob*> >*)+0x3a8) [0x5564b73b0cb8]",
        "(BlueStore::_do_remove(BlueStore::TransContext*, boost::intrusive_ptr<BlueStore::Collection>&, boost::intrusive_ptr<BlueStore::Onode>)+0xce) [0x5564b73b15ee]",
        "(BlueStore::_remove(BlueStore::TransContext*, boost::intrusive_ptr<BlueStore::Collection>&, boost::intrusive_ptr<BlueStore::Onode>&)+0x22c) [0x5564b73b316c]",
        "(BlueStore::_txc_add_transaction(BlueStore::TransContext*, ceph::os::Transaction*)+0x1fcf) [0x5564b73cb1af]",
        "(BlueStore::queue_transactions(boost::intrusive_ptr<ObjectStore::CollectionImpl>&, std::vector<ceph::os::Transaction, std::allocator<ceph::os::Transaction> >&, boost::intrusive_ptr<TrackedOp>, ThreadPool::TPHandle*)+0x316) [0x5564b73e66f6]",
        "(ObjectStore::queue_transaction(boost::intrusive_ptr<ObjectStore::CollectionImpl>&, ceph::os::Transaction&&, boost::intrusive_ptr<TrackedOp>, ThreadPool::TPHandle*)+0x85) [0x5564b6eefed5]",
        "(OSD::dispatch_context(PeeringCtx&, PG*, std::shared_ptr<OSDMap const>, ThreadPool::TPHandle*)+0xf3) [0x5564b6e84dd3]",
        "(OSD::dequeue_peering_evt(OSDShard*, PG*, std::shared_ptr<PGPeeringEvent>, ThreadPool::TPHandle&)+0x2d8) [0x5564b6eb4778]",
        "(ceph::osd::scheduler::PGPeeringItem::run(OSD*, OSDShard*, boost::intrusive_ptr<PG>&, ThreadPool::TPHandle&)+0x56) [0x5564b70e7866]",
        "(OSD::ShardedOpWQ::_process(unsigned int, ceph::heartbeat_handle_d*)+0xc28) [0x5564b6ea64e8]",
        "(ShardedThreadPool::shardedthreadpool_worker(unsigned int)+0x5c4) [0x5564b75232c4]",
        "(ShardedThreadPool::WorkThreadSharded::entry()+0x14) [0x5564b75261a4]",
        "/lib64/libpthread.so.0(+0x81ca) [0x7fb10344e1ca]",
        "clone()"
    ],
    "ceph_version": "16.2.9",
    "crash_id": "2022-07-04T09:38:35.887100Z_895047ab-c7a4-4162-ba1c-463dd6f88647",
    "entity_name": "osd.254",
    "os_id": "centos",
    "os_name": "CentOS Stream",
    "os_version": "8",
    "os_version_id": "8",
    "process_name": "ceph-osd",
    "stack_sig": "685e9ade14cafe369e502737407e80d9275da9e365c5e87c1ea6bad1e32038e3",
    "timestamp": "2022-07-04T09:38:35.887100Z",
    "utsname_hostname": "kw214-vso-pr",
    "utsname_machine": "x86_64",
    "utsname_release": "5.15.39-talos",
    "utsname_sysname": "Linux",
    "utsname_version": "#1 SMP Thu May 12 15:08:32 UTC 2022"
}
sh-4.4$ ceph -s
  cluster:
    id:     1b713b95-fb0d-4254-b83a-4421b28f35fa
    health: HEALTH_WARN
            1 osds down
            Degraded data redundancy: 301421/89274670 objects degraded (0.338%), 6 pgs degraded, 9 pgs undersized
            2060 daemons have recently crashed

  services:
    mon: 3 daemons, quorum g,h,i (age 6d)
    mgr: a(active, since 6d), standbys: b
    osd: 270 osds: 267 up (since 4m), 268 in (since 25h)

  data:
    pools:   17 pools, 801 pgs
    objects: 22.32M objects, 85 TiB
    usage:   114 TiB used, 666 TiB / 780 TiB avail
    pgs:     301421/89274670 objects degraded (0.338%)
             792 active+clean
             6   active+undersized+degraded
             3   active+undersized

  io:
    client:   583 MiB/s rd, 1.3 GiB/s wr, 5.02k op/s rd, 9.51k op/s wr

  progress:
    Global Recovery Event (15h)
      [===========================.] (remaining: 9m)
Files
Updated by Igor Fedotov almost 2 years ago
Could you please run fsck against this OSD and share the results
Updated by Aurélien Le Clainche almost 2 years ago
do you have a procedure or example to do the fsck?
Updated by Sébastien Bernard almost 2 years ago
- File osd-crash-dmesg.log osd-crash-dmesg.log added
- File osd-info-crash-2022-06-30T19_27_32.965368Z_e80e73bb-d8b5-4248-8dd4-e0a3156cf536.log osd-info-crash-2022-06-30T19_27_32.965368Z_e80e73bb-d8b5-4248-8dd4-e0a3156cf536.log added
- File osd-info-crash-2022-07-04T08_07_01.571286Z_b4eda62f-f3e8-4641-9438-f136c356817f.log osd-info-crash-2022-07-04T08_07_01.571286Z_b4eda62f-f3e8-4641-9438-f136c356817f.log added
- File osd-info-crash-2022-07-04T12_11_02.670665Z_f6c47627-9034-4eb7-8c31-beb02bedb828.log osd-info-crash-2022-07-04T12_11_02.670665Z_f6c47627-9034-4eb7-8c31-beb02bedb828.log added
Regarding this problem, /var filesystem is an xfs filesystem.
osd are setup by rook.
Rebooting the machine is enough to fsck the fs at mount time (fsck is done by mount, xfs_repair need special case).
We did reboot the faulty node without resolving the problem.
Please find attached the dmesg from the os.
Something seems very wrong.
ceph image is standard image from quai.io/ceph/ceph:16.2.9.
I attached the oldest and the second to last and last crash of osd.107 for which is still have crash report.
Updated by Aurélien Le Clainche almost 2 years ago
Sébastien Bernard wrote:
Regarding this problem, /var filesystem is an xfs filesystem.
osd are setup by rook.
Rebooting the machine is enough to fsck the fs at mount time (fsck is done by mount, xfs_repair need special case).
We did reboot the faulty node without resolving the problem.
Please find attached the dmesg from the os.
Something seems very wrong.
ceph image is standard image from quai.io/ceph/ceph:16.2.9.
I attached the oldest and the second to last and last crash of osd.107 for which is still have crash report.
We still have crashes every day, do you have any information to share with us?
Updated by Igor Fedotov almost 2 years ago
Aurélien Le Clainche wrote:
do you have a procedure or example to do the fsck?
Not sure how to do that with Rook but the command to fsck OSD looks like:
ceph-bluestore-tool --path <path-to-osd, e.g. /var/lib/ceph/osd-N> --command fsck
Updated by Aurélien Le Clainche almost 2 years ago
Igor Fedotov wrote:
Aurélien Le Clainche wrote:
do you have a procedure or example to do the fsck?
Not sure how to do that with Rook but the command to fsck OSD looks like:
ceph-bluestore-tool --path <path-to-osd, e.g. /var/lib/ceph/osd-N> --command fsck
bash-5.1# ceph-bluestore-tool --path /var/lib/rook/rook-ceph/1b713b95-fb0d-4254-b83a-4421b28f35fa_2dc34d45-02a3-42a2-9522-cddd2adc773c --command fsck
fsck success
bash-5.1#
I've already run fsck and that doesn't fix the problem.
Updated by Igor Fedotov almost 2 years ago
Aurélien Le Clainche wrote:
Igor Fedotov wrote:
Aurélien Le Clainche wrote:
do you have a procedure or example to do the fsck?
Not sure how to do that with Rook but the command to fsck OSD looks like:
ceph-bluestore-tool --path <path-to-osd, e.g. /var/lib/ceph/osd-N> --command fsck[...]
I've already run fsck and that doesn't fix the problem.
You mean there is a single failing OSD which is crashing with exactly the same backtrace and assert location from time to time and running fsck after such a crash finds nothing. Is that summary correct?
Or various OSDs are suffering from that issue?
I can see pretty different crash symptoms in Sebastian's logs. I presume they are from a different cluster, is that correct?
Updated by Aurélien Le Clainche almost 2 years ago
Igor Fedotov wrote:
Aurélien Le Clainche wrote:
Igor Fedotov wrote:
Aurélien Le Clainche wrote:
do you have a procedure or example to do the fsck?
Not sure how to do that with Rook but the command to fsck OSD looks like:
ceph-bluestore-tool --path <path-to-osd, e.g. /var/lib/ceph/osd-N> --command fsck[...]
I've already run fsck and that doesn't fix the problem.
You mean there is a single failing OSD which is crashing with exactly the same backtrace and assert location from time to time and running fsck after such a crash finds nothing. Is that summary correct?
Or various OSDs are suffering from that issue?
I can see pretty different crash symptoms in Sebastian's logs. I presume they are from a different cluster, is that correct?
it is indeed the same cluster and it happens on several osds, currently I have two osds which restart continuously. (osd-107 and osd-12)
Updated by Aurélien Le Clainche almost 2 years ago
Aurélien Le Clainche wrote:
Igor Fedotov wrote:
Aurélien Le Clainche wrote:
Igor Fedotov wrote:
Aurélien Le Clainche wrote:
do you have a procedure or example to do the fsck?
Not sure how to do that with Rook but the command to fsck OSD looks like:
ceph-bluestore-tool --path <path-to-osd, e.g. /var/lib/ceph/osd-N> --command fsck[...]
I've already run fsck and that doesn't fix the problem.
You mean there is a single failing OSD which is crashing with exactly the same backtrace and assert location from time to time and running fsck after such a crash finds nothing. Is that summary correct?
Or various OSDs are suffering from that issue?
I can see pretty different crash symptoms in Sebastian's logs. I presume they are from a different cluster, is that correct?
it is indeed the same cluster and it happens on several osds, currently I have two osds which restart continuously. (osd-107 and osd-12)
hi !
crash on osd.107 this morning:
{
    "backtrace": [
        "/lib64/libpthread.so.0(+0x12ce0) [0x7f7532a0ace0]",
        "gsignal()",
        "abort()",
        "/lib64/libstdc++.so.6(+0x9009b) [0x7f753202109b]",
        "/lib64/libstdc++.so.6(+0x9653c) [0x7f753202753c]",
        "/lib64/libstdc++.so.6(+0x96597) [0x7f7532027597]",
        "/lib64/libstdc++.so.6(+0x967f8) [0x7f75320277f8]",
        "(ceph::buffer::v15_2_0::list::iterator_impl<true>::copy(unsigned int, ceph::buffer::v15_2_0::list&)+0xb2) [0x5587a0ada172]",
        "(pg_log_entry_t::decode_with_checksum(ceph::buffer::v15_2_0::list::iterator_impl<true>&)+0xc6) [0x5587a04c0ce6]",
        "(void PGLog::read_log_and_missing<pg_missing_set<true> >(ObjectStore*, boost::intrusive_ptr<ObjectStore::CollectionImpl>&, ghobject_t, pg_info_t const&, PGLog::IndexedLog&, pg_missing_set<true>&, std::__cxx11::basic_ostringstream<char, std::char_traits<char>, std::allocator<char> >&, bool, bool*, DoutPrefixProvider const*, std::set<std::__cxx11::basic_string<char, std::char_traits<char>, std::allocator<char> >, std::less<std::__cxx11::basic_string<char, std::char_traits<char>, std::allocator<char> > >, std::allocator<std::__cxx11::basic_string<char, std::char_traits<char>, std::allocator<char> > > >*, bool)+0x1a14) [0x5587a0353b04]",
        "(PG::read_state(ObjectStore*)+0x13e7) [0x5587a0340557]",
        "(OSD::load_pgs()+0xa47) [0x5587a028c0e7]",
        "(OSD::init()+0x26f7) [0x5587a02bc567]",
        "main()",
        "__libc_start_main()",
        "_start()"
    ],
    "ceph_version": "16.2.9",
    "crash_id": "2022-07-19T02:10:55.597806Z_a3078f30-f137-46cf-9134-e3f6d7eb7b6a",
    "entity_name": "osd.107",
    "os_id": "centos",
    "os_name": "CentOS Stream",
    "os_version": "8",
    "os_version_id": "8",
    "process_name": "ceph-osd",
    "stack_sig": "951c75224296b8e62c3acf78d34b418e0e7a491cf48d138754101bf52bbb9df4",
    "timestamp": "2022-07-19T02:10:55.597806Z",
    "utsname_hostname": "kw210-vso-pr",
    "utsname_machine": "x86_64",
    "utsname_release": "5.15.36-talos",
    "utsname_sysname": "Linux",
    "utsname_version": "#1 SMP Wed Apr 27 17:49:57 UTC 2022"
}
Updated by Igor Fedotov almost 2 years ago
Hi!
May I have some clarifications then.
I can see multiple backtraces for .107 like the last one. All are happening in load_pgs() function which implies OSD is [re]-starting. Hence some questions:
1) Is this OSD able to start at all? If so - does it crash over time or restart is happening due to other reasons? What's the backtrace/last log output then? You might need to access OSD logs for that - originally they're located under /var/log/ceph/... but unfortunately I have no idea how this is implemented under rook.
2) Have you run fsck for OSD.107 as well? From your comment above it's not clear what OSD have you run fsck successfully for..
3) Can't you see weird/high RAM usage during OSD.107 startup and/or regular running?
4) You mentioned osd.12 is also crashing - please share log output. Is it at the same node as osd.107 or not? What's about other crashes if any - are they at different nodes?
5) Originally OSD.254 was crashing (with a completely different backtrace) - is it still happening? If so - please share the last OSD log snippets prior to that.
Updated by Aurélien Le Clainche almost 2 years ago
- File crash-osd-107.txt crash-osd-107.txt added
- File Screenshot from 2022-07-19 14-25-53.png Screenshot from 2022-07-19 14-25-53.png added
- File crash-osd-12.txt crash-osd-12.txt added
Igor Fedotov wrote:
Hi!
May I have some clarifications then.
I can see multiple backtraces for .107 like the last one. All are happening in load_pgs() function which implies OSD is [re]-starting. Hence some questions:1) Is this OSD able to start at all? If so - does it crash over time or restart is happening due to other reasons? What's the backtrace/last log output then? You might need to access OSD logs for that - originally they're located under /var/log/ceph/... but unfortunately I have no idea how this is implemented under rook.
This osd.107 does not start at all and restarts in a loop, attached the log file (crash-osd-107.txt).
2) Have you run fsck for OSD.107 as well? From your comment above it's not clear what OSD have you run fsck successfully for..
yes yesterday, I restarted the fsck of the osd 107.
/ # cat /var/lib/rook/rook-ceph/1b713b95-fb0d-4254-b83a-4421b28f35fa_2dc34d45-02a3-42a2-9522-cddd2adc773c/whoami
107
/ #
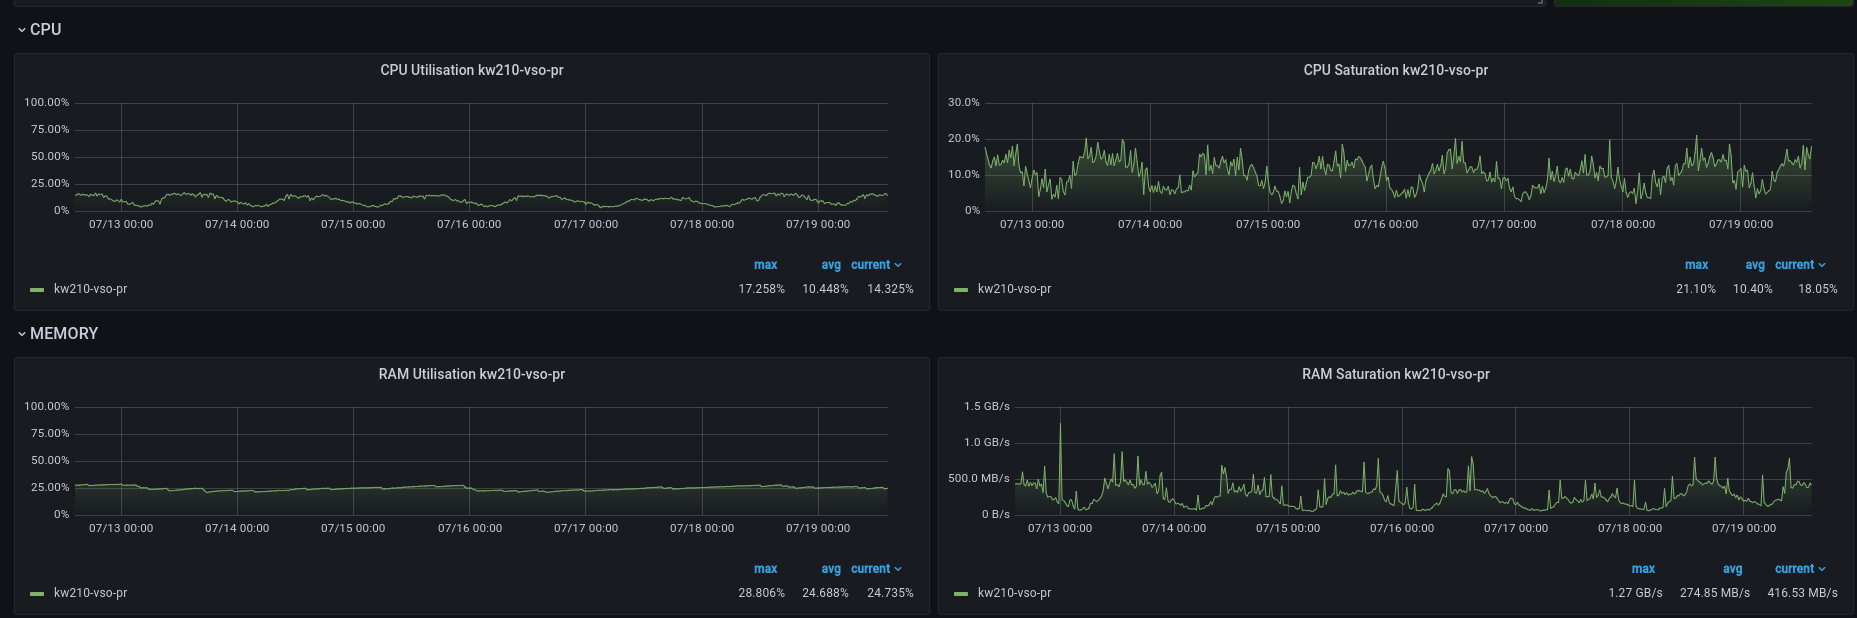
3) Can't you see weird/high RAM usage during OSD.107 startup and/or regular running?
no weird ram/cpu usage, I have attached the cpu/ram consumption over the last 7 days
4) You mentioned osd.12 is also crashing - please share log output. Is it at the same node as osd.107 or not? What's about other crashes if any - are they at different nodes?
the crash is not linked to a particular host, example with the osd .12 which crashes on another host, log file attached. (crash-osd-12)
5) Originally OSD.254 was crashing (with a completely different backtrace) - is it still happening? If so - please share the last OSD log snippets prior to that.
osd.254 no longer crashes, I formatted the osd and redeployed it. I can't see myself doing this every time there is a crash on an osd.
Updated by Igor Fedotov almost 2 years ago
Well, this doesn't look like a bluestore issue anymore. Neither I can't see any clues it's the same as the original one.
Given the last OSD logs it's apparently a corrupted entry in a PG log which prevent OSD to start up.
So I can see two subtasks with that:
1) Make broken OSD to start.
If you have enough experience (and/or courage) you might want to treat affected OSDs with ceph-objectstore-tool and fix broken PG via PG export/import from either local (unlikely) or remote (likelyt) replica (using export/export-remove/remove commands) or just remove a PG and make Ceph to recover that automatically.
From the log you sHow to determine the broken PG id? In the log you shared one can see the following pattern:
-1> 2022-07-19T12:26:04.029+0000 7f0bdf9e8200 5 osd.12 pg_epoch: 22831 pg[16.68(unlocked)] enter Initial
0> 2022-07-19T12:26:04.121+0000 7f0bdf9e8200 -1 ** Caught signal (Aborted) * in thread 7f0bdf9e8200 thread_name:ceph-osd
Highly likely the PG mentioned in the first line is the culprit, i.e. PG id is 16.68 in this case.
Please note that there might be more that one broken PG so you'll need to treat all of them by reiterating PG export/import multiple times.
2) Investigate the root cause for such entry(-ies) appearance. At least we need to understand what had been happening to OSD before the first startup failure appearance - hence we need relevant log(S) for that period. Not to mention this might be far from enough and potentially this investigation looks like a tricky task. I'd be glad to take a look at the mentioned "first appearance" log if any but I'm not sure I'll be available for a thorough investigation
Hope this helps.
Updated by Sébastien Bernard almost 2 years ago
We spent full last day to recover 4 osds that wouldn't come back up.
We saw on the machines a lot of errors like this in the dmesg.
Could this be related ?
```
[Wed Jul 20 07:38:43 2022] bstore_kv_final53756: segfault at 0 ip 00007fd0f81a3573 sp 00007fd0e7bc5ef0 error 4 in libtcmalloc.so.4.5.3[7fd0f8178000+4d000]
[Wed Jul 20 07:38:44 2022] Code: d9 4c 89 e7 41 29 df e8 4b c0 fe ff 44 39 fb 7c a6 48 8b 75 00 48 89 f2 41 83 ff 01 7e 14 b8 01 00 00 00 0f 1f 40 00 83 c0 01 <48> 8b 12 41 39 c7 75 f5 48 8b 02 48 89 45 00 48 c7 02 00 00 00 00
[Wed Jul 20 18:54:44 2022] bstore_kv_final242382: segfault at 0 ip 00007fece5b99573 sp 00007fecd55bbef0 error 4 in libtcmalloc.so.4.5.3[7fece5b6e000+4d000]
[Wed Jul 20 18:54:44 2022] traps: tp_osd_tp242427 general protection fault ip:7fece5ba9d6a sp:7fecc2f5bdc8 error:0
[Wed Jul 20 18:54:44 2022] tp_osd_tp242434: segfault at 0 ip 00007fece5b99573 sp 00007fecbf74c420 error 4 in libtcmalloc.so.4.5.3[7fece5b6e000+4d000]
[Wed Jul 20 18:54:44 2022] Code: d9 4c 89 e7 41 29 df e8 4b c0 fe ff 44 39 fb 7c a6 48 8b 75 00 48 89 f2 41 83 ff 01 7e 14 b8 01 00 00 00 0f 1f 40 00 83 c0 01 <48> 8b 12 41 39 c7 75 f5 48 8b 02 48 89 45 00 48 c7 02 00 00 00 00
[Wed Jul 20 18:54:44 2022] Code: d9 4c 89 e7 41 29 df e8 4b c0 fe ff 44 39 fb 7c a6 48 8b 75 00 48 89 f2 41 83 ff 01 7e 14 b8 01 00 00 00 0f 1f 40 00 83 c0 01 <48> 8b 12 41 39 c7 75 f5 48 8b 02 48 89 45 00 48 c7 02 00 00 00 00
[Wed Jul 20 18:54:44 2022] in libtcmalloc.so.4.5.3[7fece5b6e000+4d000]
[Fri Jul 22 09:35:30 2022] traps: msgr-worker-264574 general protection fault ip:7fc2ca340d6a sp:7fc2c47f3ab8 error:0 in libtcmalloc.so.4.5.3[7fc2ca305000+4d000]
[Fri Jul 22 09:35:30 2022] traps: bstore_kv_final65681 general protection fault ip:7fc2c846b99d sp:7fc2b9d4c110 error:0 in libc-2.28.so[7fc2c841a000+1bc000]
```
Updated by Igor Fedotov almost 2 years ago
Sébastien Bernard wrote:
We spent full last day to recover 4 osds that wouldn't come back up.
We saw on the machines a lot of errors like this in the dmesg.
Could this be related ?
Can't say for sure but definitely this looks suspicious. Curious what's present in relevant OSD log(s) at those points in time?
```
[Wed Jul 20 07:38:43 2022] bstore_kv_final53756: segfault at 0 ip 00007fd0f81a3573 sp 00007fd0e7bc5ef0 error 4 in libtcmalloc.so.4.5.3[7fd0f8178000+4d000]
[Wed Jul 20 07:38:44 2022] Code: d9 4c 89 e7 41 29 df e8 4b c0 fe ff 44 39 fb 7c a6 48 8b 75 00 48 89 f2 41 83 ff 01 7e 14 b8 01 00 00 00 0f 1f 40 00 83 c0 01 <48> 8b 12 41 39 c7 75 f5 48 8b 02 48 89 45 00 48 c7 02 00 00 00 00
[Wed Jul 20 18:54:44 2022] bstore_kv_final242382: segfault at 0 ip 00007fece5b99573 sp 00007fecd55bbef0 error 4 in libtcmalloc.so.4.5.3[7fece5b6e000+4d000]
[Wed Jul 20 18:54:44 2022] traps: tp_osd_tp242427 general protection fault ip:7fece5ba9d6a sp:7fecc2f5bdc8 error:0
[Wed Jul 20 18:54:44 2022] tp_osd_tp242434: segfault at 0 ip 00007fece5b99573 sp 00007fecbf74c420 error 4 in libtcmalloc.so.4.5.3[7fece5b6e000+4d000]
[Wed Jul 20 18:54:44 2022] Code: d9 4c 89 e7 41 29 df e8 4b c0 fe ff 44 39 fb 7c a6 48 8b 75 00 48 89 f2 41 83 ff 01 7e 14 b8 01 00 00 00 0f 1f 40 00 83 c0 01 <48> 8b 12 41 39 c7 75 f5 48 8b 02 48 89 45 00 48 c7 02 00 00 00 00
[Wed Jul 20 18:54:44 2022] Code: d9 4c 89 e7 41 29 df e8 4b c0 fe ff 44 39 fb 7c a6 48 8b 75 00 48 89 f2 41 83 ff 01 7e 14 b8 01 00 00 00 0f 1f 40 00 83 c0 01 <48> 8b 12 41 39 c7 75 f5 48 8b 02 48 89 45 00 48 c7 02 00 00 00 00
[Wed Jul 20 18:54:44 2022] in libtcmalloc.so.4.5.3[7fece5b6e000+4d000]
[Fri Jul 22 09:35:30 2022] traps: msgr-worker-264574 general protection fault ip:7fc2ca340d6a sp:7fc2c47f3ab8 error:0 in libtcmalloc.so.4.5.3[7fc2ca305000+4d000]
[Fri Jul 22 09:35:30 2022] traps: bstore_kv_final65681 general protection fault ip:7fc2c846b99d sp:7fc2b9d4c110 error:0 in libc-2.28.so[7fc2c841a000+1bc000]
```
Updated by Sébastien Bernard over 1 year ago
Hello, a quick follow up to say the problem has been resolved.
We removed the 15Gib memory limit per OSD and crashes were gone.
We don't know why there is error in tcmalloc while not triggering and OOMKill when memory limit is reached.
Updated by Igor Fedotov over 1 year ago
Hi Sebastien,
does the above mean that OSDs are using more that 15GB RAM at some point?
How large is the peak then? At what stage (startup/shutdown/regular functioning) does it happen?
Updated by Sébastien Bernard over 1 year ago
Igor,
We can't know how large is the peak since we removed rook osd limits.
Without limit, the biggest OSD is taking 55Gib of memory and the smallest around 1.5 Gib.
I think rook is setting the osd_memory_target according to the memory limit it puts on the pod.
We're also using erasure coding and topology which may or not put some pressure on host ressource.
The crash occured randomly while running. Moreover, the crashes seems to corrupt the osd data randomly also.
First symptom is this line in the dmesg related to tcmalloc.