Actions
Bug #55133
closedmgr/dashboard: Error message of /api/grafana/validation is not helpful
Status:
Resolved
Priority:
Normal
Assignee:
Category:
Monitoring
Target version:
% Done:
0%
Source:
Development
Tags:
Backport:
pacific, quincy
Regression:
No
Severity:
3 - minor
Reviewed:
Affected Versions:
ceph-qa-suite:
Pull request ID:
Crash signature (v1):
Crash signature (v2):
Description
If the validation of a Grafana URL fails, there is only a meaningless default error message without content that is helpful to find out what is going wrong.
E.g. if Grafana is uing a self signed SSL certificate or the common name is incorrect, the error message does not give any hint that the validation has been failed.
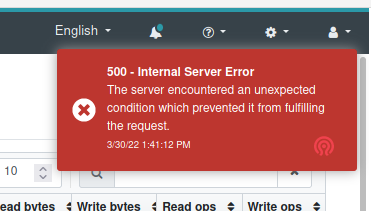
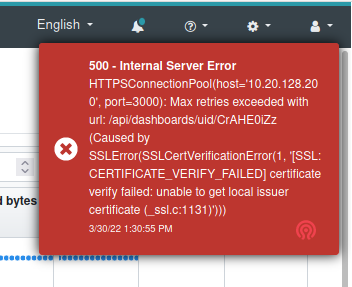
This is what is expected:
Files
Actions
#1
Updated by Volker Theile about 2 years ago
- File before.png before.png added
- File after.png after.png added
- Description updated (diff)
Updated by Volker Theile about 2 years ago
- Status changed from New to In Progress
Updated by Volker Theile about 2 years ago
- Status changed from In Progress to Fix Under Review
- Pull request ID set to 45708
Updated by Ernesto Puerta almost 2 years ago
- Status changed from Fix Under Review to Pending Backport
Updated by Backport Bot almost 2 years ago
- Copied to Backport #55378: pacific: mgr/dashboard: Error message of /api/grafana/validation is not helpful added
Updated by Backport Bot almost 2 years ago
- Copied to Backport #55379: quincy: mgr/dashboard: Error message of /api/grafana/validation is not helpful added
Updated by Ernesto Puerta almost 2 years ago
- Status changed from Pending Backport to Resolved
Actions