Bug #53926
closedrocksdb's Option.ttl may be beneficial for RGW index workload
100%
Description
Background
In our environment a lot of RGW workloads have lifecycle or customers doing a lot of DELETE/PUT on their buckets. These workload create a lot of tombstones which slows omap_iterator until the OSD eventually start to complain:
2021-12-22 19:10:22.201 7f19eb59f700  0 bluestore(/var/lib/ceph/osd/ceph-19) log_latency_fn slow operation observed for upper_bound, latency = 6.25955s, after = <redacted_key_name> omap_iterator(cid = 14.311_head, oid = <redacted_object_name>
2021-12-22 19:10:34.370 7f19eb59f700  0 bluestore(/var/lib/ceph/osd/ceph-19) log_latency_fn slow operation observed for upper_bound, latency = 6.0164s, after = <redacted_key_name> omap_iterator(cid = 14.311_head, oid = <redacted_object_name>
In the most extreme scenarios, this issue created a lot of slow requests (10k+) on the PG which results in an outage. On some clusters we have no alternatives but to trigger a compaction thrice a day.
Options.ttl
While looking at rocksdb options, the following was discovered: https://github.com/facebook/rocksdb/wiki/RocksDB-Tuning-Guide#periodic-and-ttl-compaction. Because our production runs on Nautilus we decided to investigate options.ttl instead of option.periodic_compation_seconds. Note: ttl is disabled on Nautilus version of rocksdb and set at 30 days with Pacific
I ran two sets of benchmarks:
- On a 10M keys omap object: with a rate capped at 10k keys/s list 10k keys -> delete listed keys -> repeat until all keys are deleted. ttl was set at 30min
- On a 10M keys omap object: Send the following distribution (max: 100/s): 11 keys list, 44 keys insert, 44 keys delete. ttl was set at 60min
Results
All OSDs were manually compacted prior to running the bench.
For the 10k list -> deletes (ran on Pacific):
Default non-ttl: Showed an increase in latency some drops happen due to general compaction but latency never returns to its start value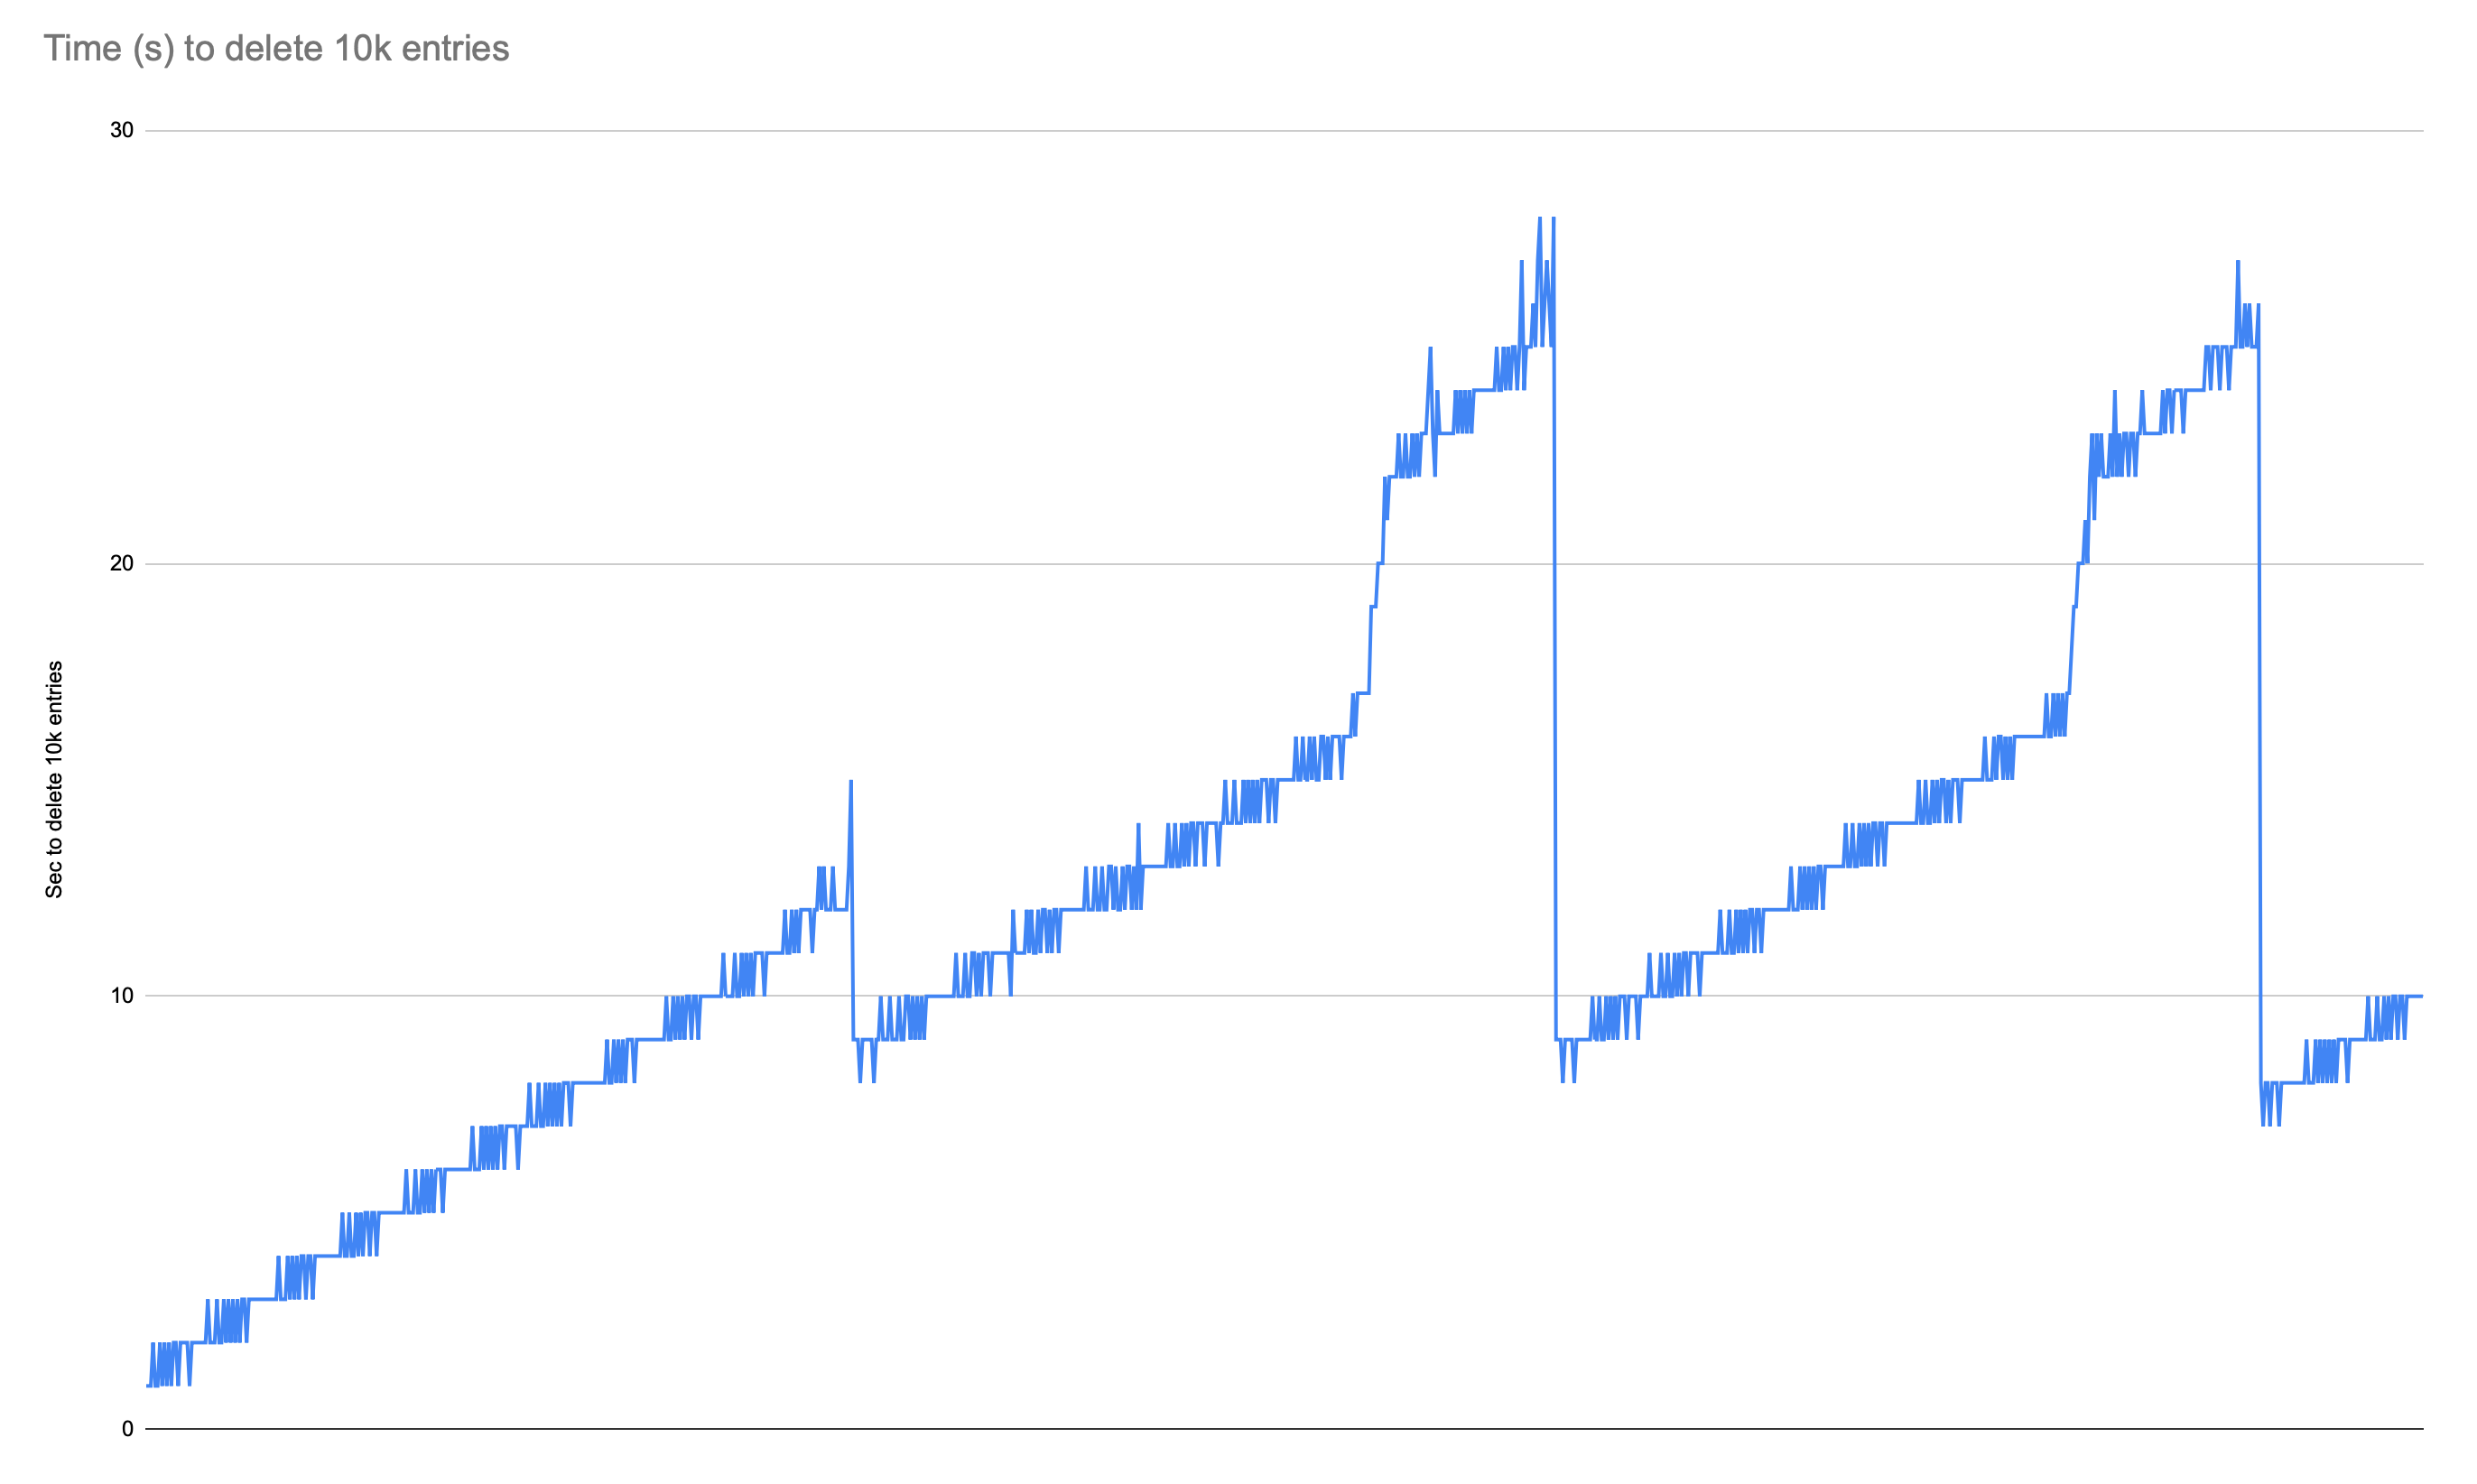
ttl=30min: Steady increase of latency followed by a drop to start value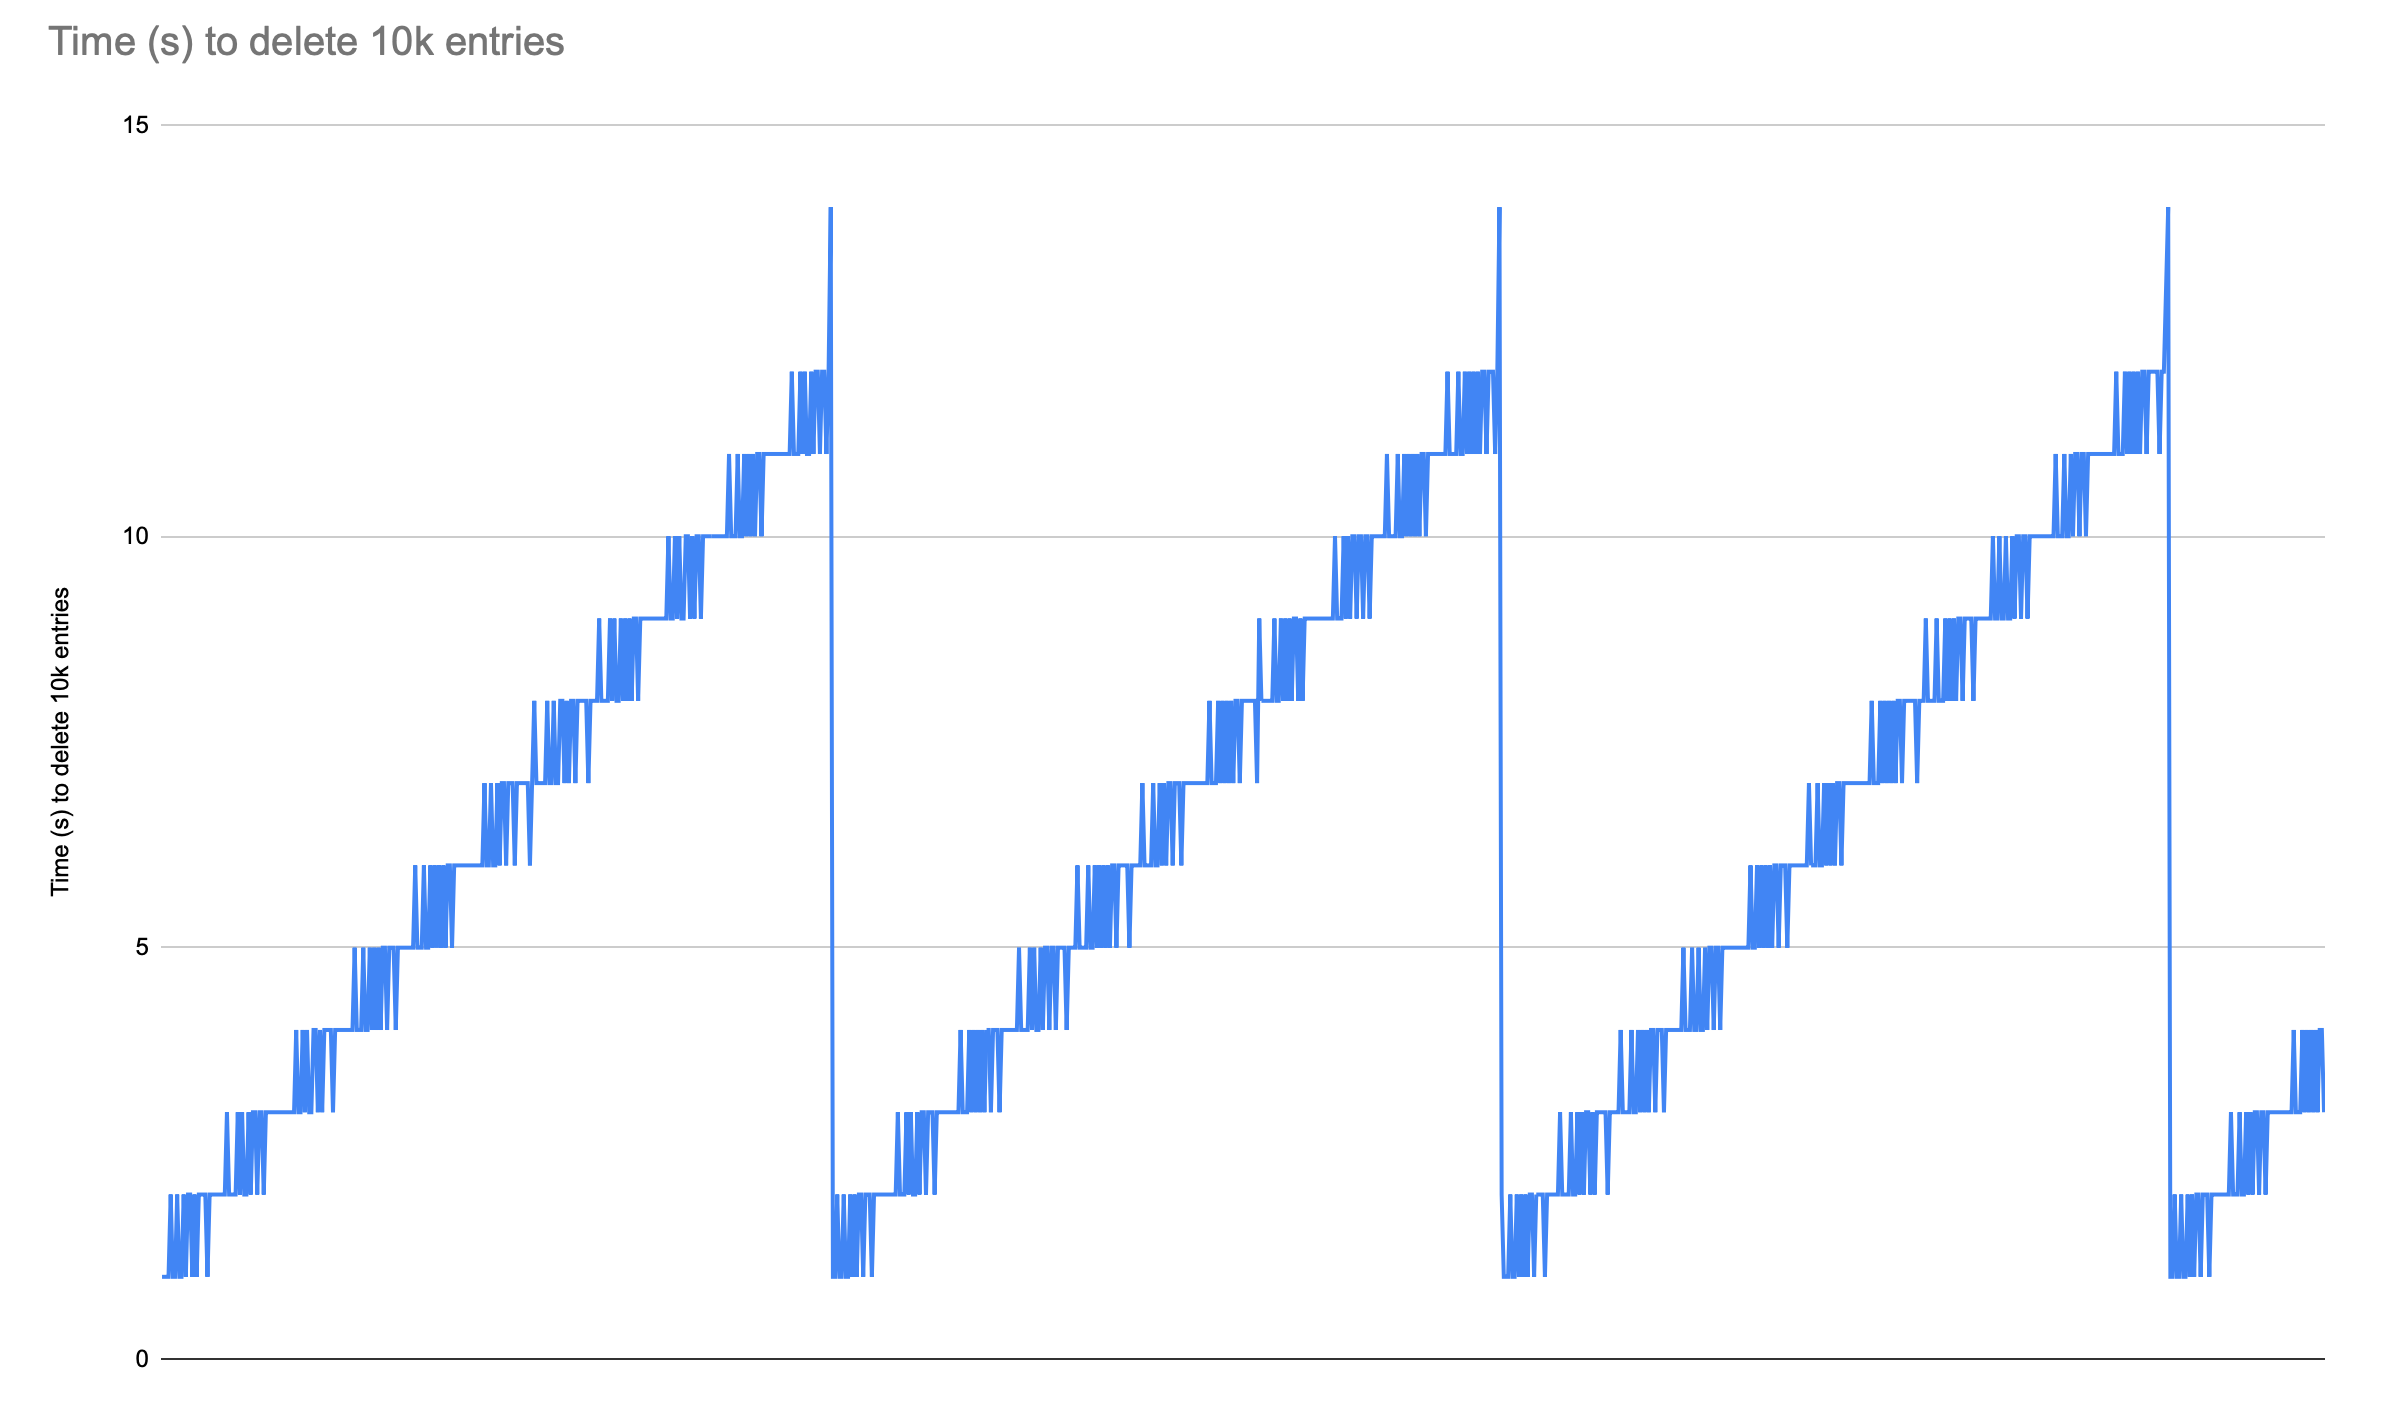
For the workload distribution test (ran on Nautilus)
Default non-ttl:You can clearly see latency increasing over time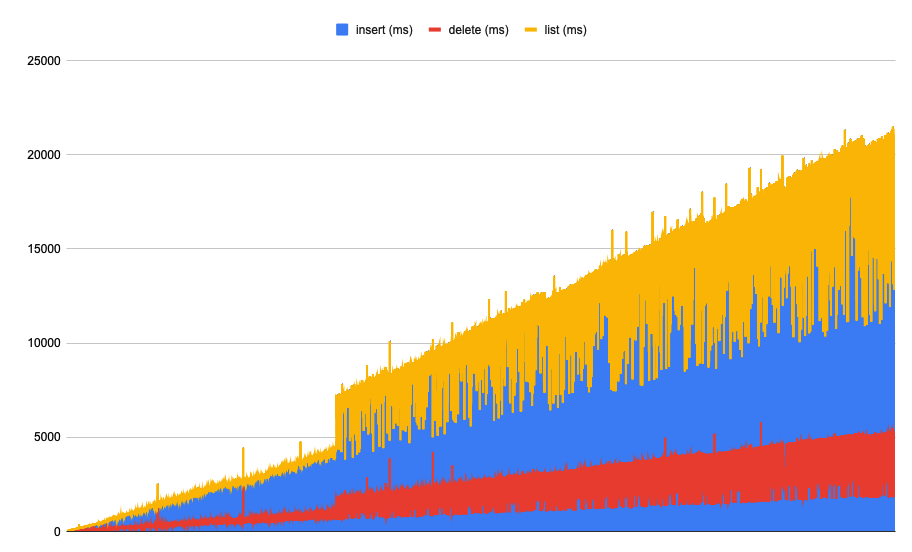
ttl=1h: latency still increases over time. When TTL compaction is triggered there's a high latency spike followed by a significant drop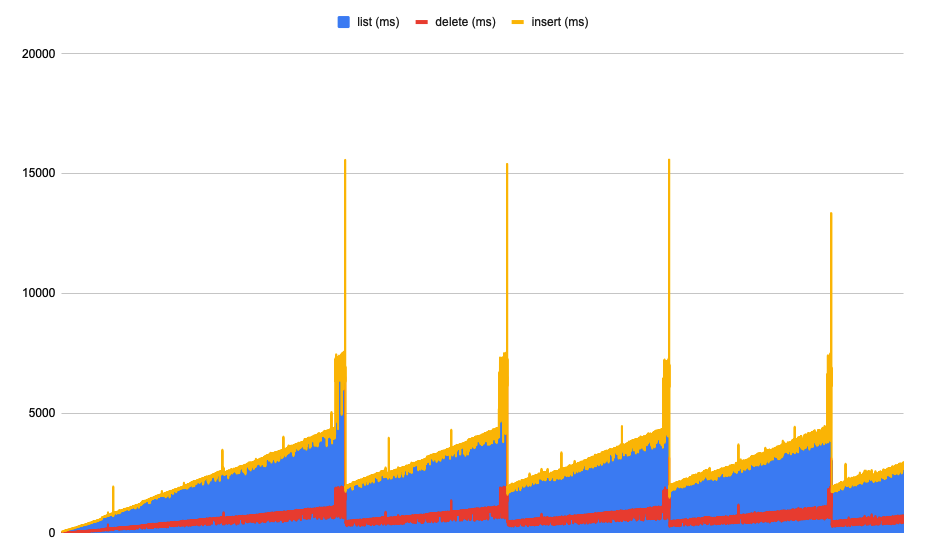
Conclusion
We started to deploy ttl compaction in prod but based off of this I'm not sure whether TTL should be changed upstream or not. I think it needs more investigation to make sure it doesn't negatively affect some workloads but I'm not sure to how to proceed with this. This ticket to gather more data or tests we could run.
Files
Updated by Alexandre Marangone about 2 years ago
Ran my omap-bench tests on an omap object with 100k keys which is more in line with RGW's recommendation. As expected the results are similar in pattern.
Updated by Alexandre Marangone about 1 year ago
- File Pacific - patched.png Pacific - patched.png added
- File Pacific - vanilla.png Pacific - vanilla.png added
I've run very similar bench to the ones described above on 16.2.11 with https://github.com/ceph/ceph/pull/47221 backported.
The results are significant.
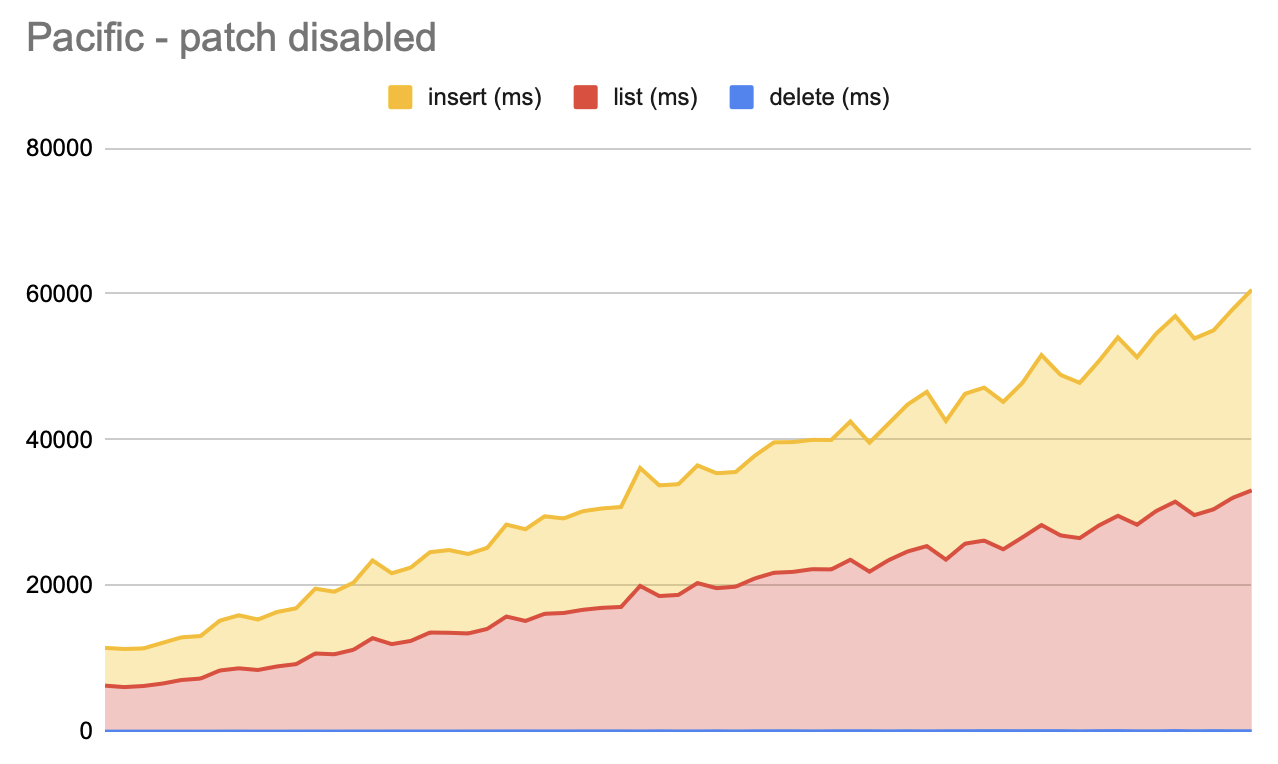
Without the patch:
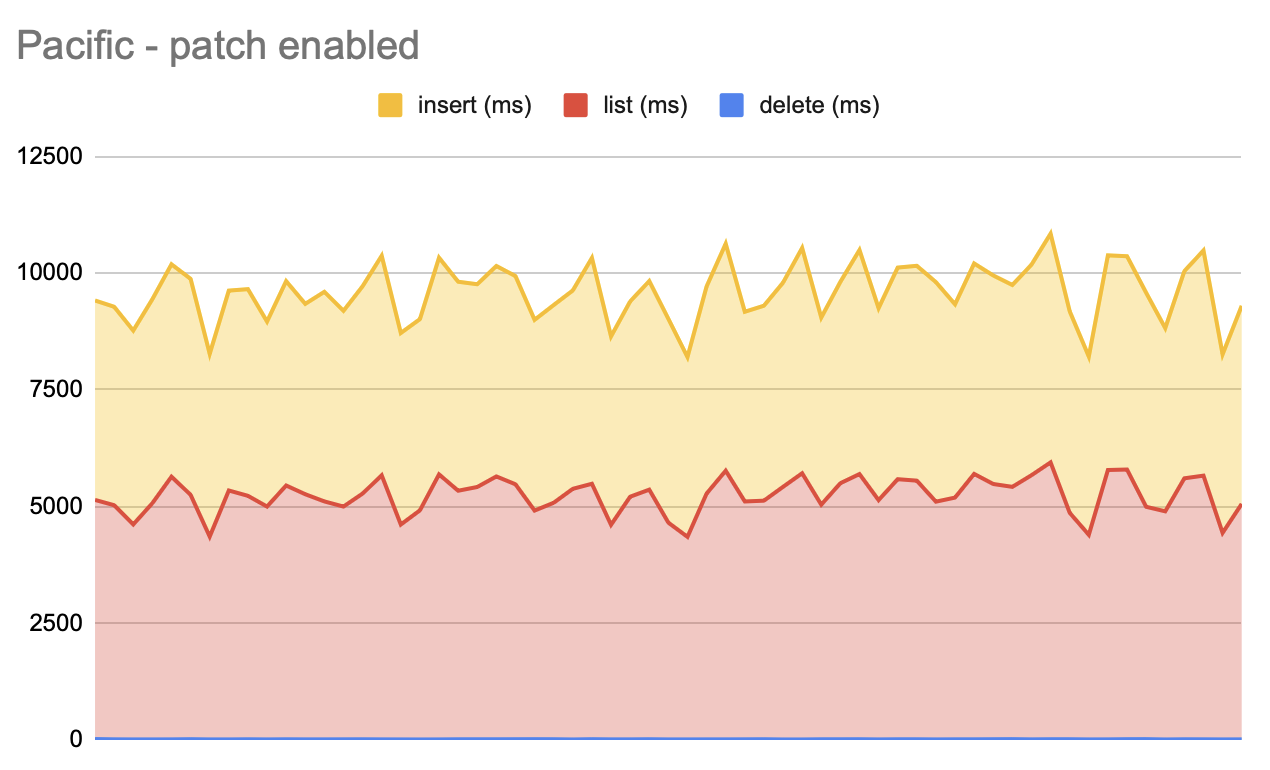
With the patch:
The deletes are graphs but they're too quick to show up with the graph's scale.
The average delete time in ms was 41 for the no patch and 7 for the patched one.
Going to close this tracker since it appears the perf degradation is fixed!
Updated by Alexandre Marangone about 1 year ago
- Status changed from New to Closed
Updated by jianwei zhang about 1 year ago
I don't quite understand why insert can cost 10000ms (10s).
Updated by jianwei zhang about 1 year ago
I think at any time, insert should be lower than list latency,
I'm curious. I hope I can explain.
Thank you very much!
Updated by Alexandre Marangone about 1 year ago
It doesn't take 10s, the graphs are stacked and this is the time to insert 10k keys. The bench that I wrote is also extremely chaotic and raw. It will attempt to insert/list/delete 10k keys to the same object (thus 1PG) at the same time. To make things even worse the omap has 1M entries to start with.
The tl;dr; is that I wanted to create something somewhat unrealistic but still the worst case scenario for rocksdb in order to quickly (minutes) reproduce the performance degradation that we've seen pile up slowly overtime (months) and that seemed to do the trick. Because of this the performance numbers themselves aren't really relevant, the pattern of latency over time is.
Hope that helps
Updated by jianwei zhang about 1 year ago
Can you share the bench tool?
I haven't been able to find a way to reproduce lately.
Thank you so much!
Updated by Alexandre Marangone about 1 year ago
Sure it's super rough and gross, Never got time to work on it much but: https://gist.github.com/alram/ecfcf90035403fcf5a2dfff27daabf37
Updated by Cory Snyder about 1 year ago
- Related to Backport #59329: quincy: kv/RocksDBStore: Add CompactOnDeletion support added
Updated by Cory Snyder about 1 year ago
- Related to Backport #59330: pacific: kv/RocksDBStore: Add CompactOnDeletion support added
Updated by Igor Fedotov 12 months ago
- Status changed from Closed to Pending Backport
- Pull request ID set to 47221
Updated by Konstantin Shalygin 8 months ago
- Tracker changed from Feature to Bug
- Status changed from Pending Backport to Resolved
- % Done changed from 0 to 100
- Regression set to No
- Severity set to 3 - minor