Bug #53542
openCeph Metadata Pool disk throughput usage increasing
0%
Description
Hi All,
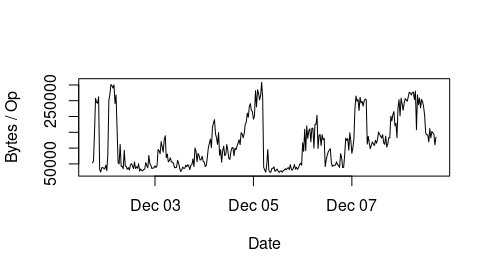
We have been observing that if we let our MDS run for some time, the bandwidth usage of the disks in the metadata pool starts increasing significantly (whilst IOPS is about constant), even though the number of clients, the workloads or anything else doesn't change.
However, after restarting the MDS, the issue goes away for some time and the same workloads require 1/10th of the metadata disk bandwidth whilst doing the same IOPS.
We run our CephFS cluster in a cloud environment where the disk throughput / bandwidth capacity is quite expensive to increase and we are hitting bandwidth / throughput limits, even though we still have a lot of IOPS capacity left.
We suspect that somehow the journaling of the MDS becomes more extensive (i.e. larger journal updates for each operation), but we couldn't really pin down which parameter might affect this.
I attach a plot of how the Bytes / Operation (throughput in bytes per sec / IOPS) evolves over time, when we restart the MDS, it drops to around 32kb (even though the min block size for the metadata pool OSDs is 4kb in our settings) and then increases over time to around 300kb.
Any insight into whether this is "normal" behaviour or how to tune this would be really appreciated.
Files
Updated by Andras Sali over 2 years ago
We also did a dump of the objecter_requests and it seems there are some large objects written by the mds-es?
ceph --admin-daemon /var/run/ceph/ceph-mds.vm-az2-2.asok objecter_requests
{
    "ops": [
        {
            "tid": 9532804,
            "pg": "3.f9c235d7",
            "osd": 2,
            "object_id": "200.02c7a084",
            "object_locator": "@3",
            "target_object_id": "200.02c7a084",
            "target_object_locator": "@3",
            "paused": 0,
            "used_replica": 0,
            "precalc_pgid": 0,
            "last_sent": "1121127.434264s",
            "age": 0.016000104000000001,
            "attempts": 1,
            "snapid": "head",
            "snap_context": "0=[]",
            "mtime": "2021-12-10T08:35:34.582215+0000",
            "osd_ops": [
                "write 0~4194304 [fadvise_dontneed] in=4194304b"
            ]
        },
        {
            "tid": 9532806,
            "pg": "3.abba2e66",
            "osd": 2,
            "object_id": "200.02c7a085",
            "object_locator": "@3",
            "target_object_id": "200.02c7a085",
            "target_object_locator": "@3",
            "paused": 0,
            "used_replica": 0,
            "precalc_pgid": 0,
            "last_sent": "1121127.438264s",
            "age": 0.012000078000000001,
            "attempts": 1,
            "snapid": "head",
            "snap_context": "0=[]",
            "mtime": "2021-12-10T08:35:34.589044+0000",
            "osd_ops": [
                "write 0~1236893 [fadvise_dontneed] in=1236893b"
            ]
        },
        {
            "tid": 9532807,
            "pg": "3.abba2e66",
            "osd": 2,
            "object_id": "200.02c7a085",
            "object_locator": "@3",
            "target_object_id": "200.02c7a085",
            "target_object_locator": "@3",
            "paused": 0,
            "used_replica": 0,
            "precalc_pgid": 0,
            "last_sent": "1121127.442264s",
            "age": 0.0080000520000000006,
            "attempts": 1,
            "snapid": "head",
            "snap_context": "0=[]",
            "mtime": "2021-12-10T08:35:34.592283+0000",
            "osd_ops": [
                "write 1236893~510649 [fadvise_dontneed] in=510649b"
            ]
        },
        {
            "tid": 9532808,
            "pg": "3.abba2e66",
            "osd": 2,
            "object_id": "200.02c7a085",
            "object_locator": "@3",
            "target_object_id": "200.02c7a085",
            "target_object_locator": "@3",
            "paused": 0,
            "used_replica": 0,
            "precalc_pgid": 0,
            "last_sent": "1121127.442264s",
            "age": 0.0080000520000000006,
            "attempts": 1,
            "snapid": "head",
            "snap_context": "0=[]",
            "mtime": "2021-12-10T08:35:34.592387+0000",
            "osd_ops": [
                "write 1747542~13387 [fadvise_dontneed] in=13387b"
            ]
        }
    ],
    "linger_ops": [],
    "pool_ops": [],
    "pool_stat_ops": [],
    "statfs_ops": [],
    "command_ops": []
}
Updated by Xiubo Li over 2 years ago
In heavy load case, the MDLog could accumulate many journal log events and could be submit in batch to metadata pool in a short time due to some rasons, like the non-fair mds_lock and submit_mutex issues, which could make the submitting the journal log extensive.
Have you tried to change the "mds_log_events_per_segment" and "mds_log_max_segments" options ?
Updated by Andras Sali over 2 years ago
Thanks for the reply, we tried decreasing the mds_log_max_segments option, but didn't really notice a difference.
We run 2 active MDS-es, so I was wondering if we might be hitting the issue listed here?
https://www.spinics.net/lists/ceph-users/msg43626.html
However we essentially pin all of our directories using ephemeral pins to a given MDS, so I am not sure if the load balancing has any impact. Can that be turned off?
Updated by Andras Sali over 2 years ago
We are considering to increase the "activity" based thresholds to see if we get less metadata IO.
We were actually wondering: if a directory is ephemerally pinned (so always served by a fixed MDS), do activity based fragmentation thresholds still apply? It wouldn't make sense to fragment a directory if there are lots of reads for example as after fragmentation, the same MDS will still serve the requests, no?
Updated by Xiubo Li over 2 years ago
- Related to Bug #40002: mds: not trim log under heavy load added
Updated by Xiubo Li over 2 years ago
- Related to Bug #52280: Mds crash and fails with assert on prepare_new_inode added
Updated by Venky Shankar over 2 years ago
- Status changed from New to Triaged
- Assignee set to Xiubo Li
- Backport set to pacific
- Component(FS) MDS added
- Labels (FS) task(medium) added
Updated by Xiubo Li over 2 years ago
I have figured out one case may could cause this, please see the tracker https://tracker.ceph.com/issues/53623.
Just in case that there has a large number of subtrees in mds.0 and the size of ESubtreeMap event could reach up to 4MB. Then it's possibly that for each LogSegment will only contain 2 event, that means when the an MDS is submitting each new event, it's possibly will use a whole LogSegment.
I think the most of handwidth usage could be writing the ESubtreeMap events to metadata pool.
Updated by Xiubo Li over 2 years ago
- Related to Bug #53623: mds: LogSegment will only save one ESubtreeMap event if the ESubtreeMap event size is large enough. added
Updated by Xiubo Li over 2 years ago
- Status changed from Triaged to Fix Under Review