Actions
Documentation #52656
closedmgr/prometheus: wron unit in RBD latency metric description
Status:
Resolved
Priority:
Low
Assignee:
Category:
prometheus module
Target version:
% Done:
100%
Tags:
Backport:
Reviewed:
Affected Versions:
Pull request ID:
Description
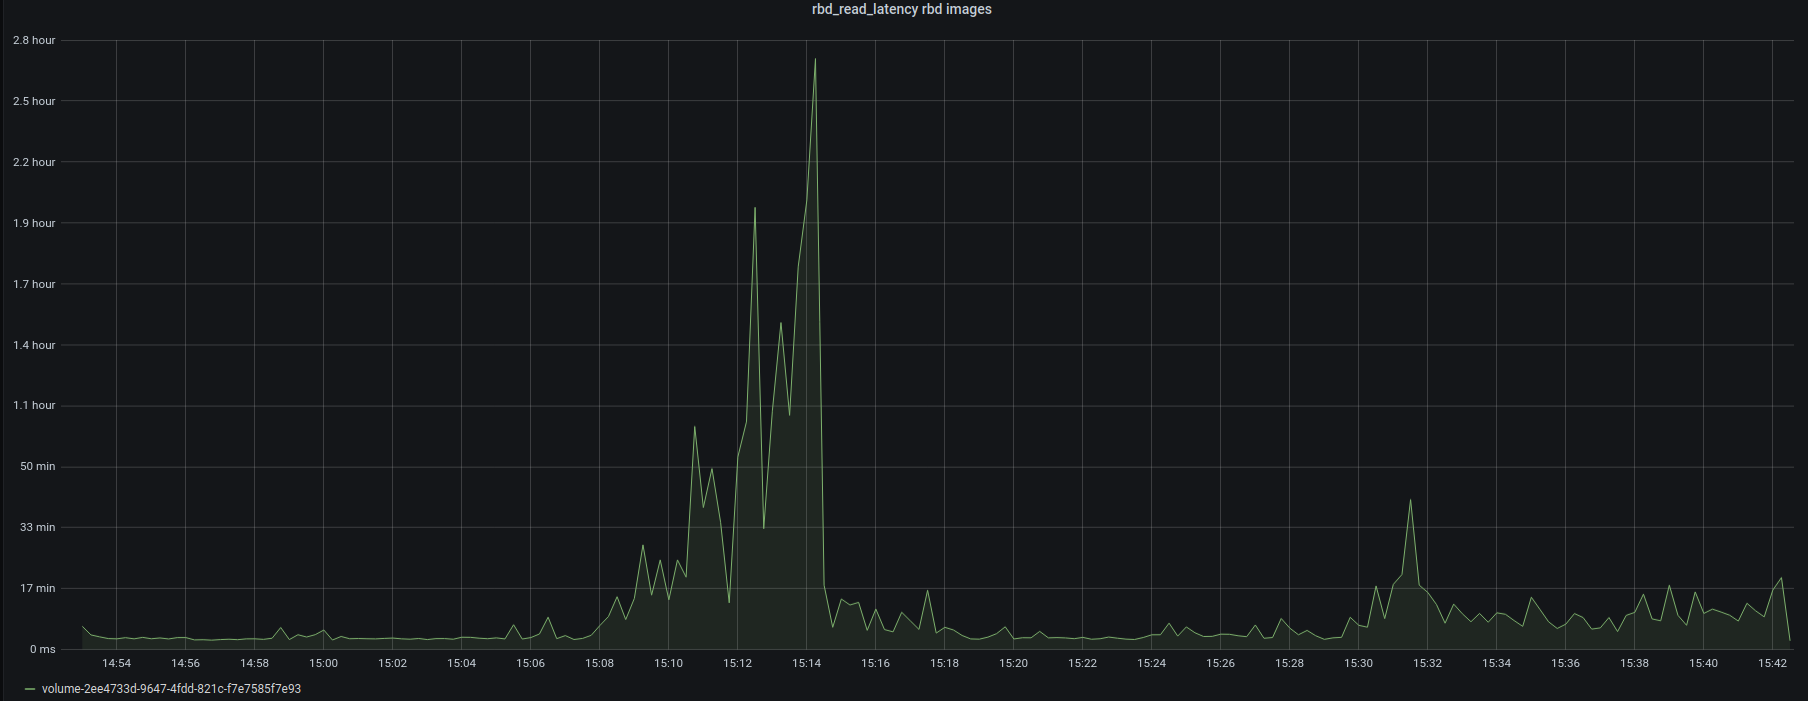
For _write_latency and _read_latency metrics the unit in description is msec, and users who makes dashboards was discouraged when see latencies for disks in hours, because actual unit should be nsec

Files
Updated by Konstantin Shalygin over 2 years ago
- Tracker changed from Bug to Documentation
- Status changed from New to In Progress
- Pull request ID set to 43217
Updated by Anthony D'Atri over 2 years ago
I've looked at `monitoring/grafana/dashboards/rbd-overview.json` and `monitoring/grafana/dashboards/rbd-overview.json` and in both the Y axis unit appears to be set to `ns` in both.
But since the pane titles here are "Average Latency", I suspect that those aren't what you're talking about.
`src/pybind/mgr/prometheus/module.py` however does describe these metrics in terms of ms so I suspect that's what you ran into.
https://github.com/ceph/ceph/pull/43479
Updated by Konstantin Shalygin 8 months ago
- Status changed from In Progress to Resolved
- Target version changed from v17.0.0 to v19.0.0
- % Done changed from 0 to 100
- Backport deleted (
pacific octopus)
Actions