Bug #51212
closedmgr/dashboard: Grafana dashboards clean-up
0%
Description
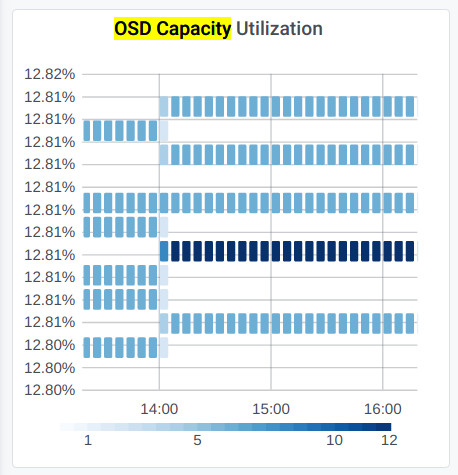
OSD Capacity units Grafana widget has bad decimals
Current:
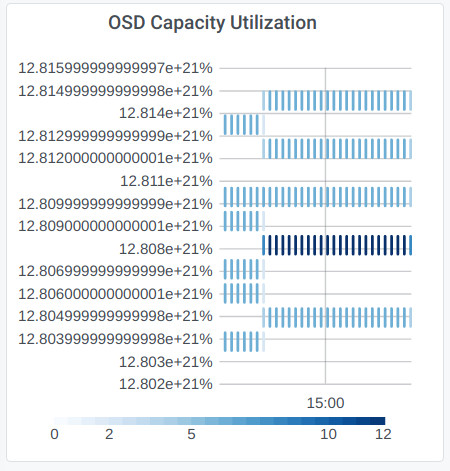
      "yAxis": {
        "decimals": 2,
Health Status widget breaks if query returns two rows
The health Status widget breaks if query returns two rows, which happens when a mgr instance fails (over). If a time frame in Grafana is selected in which that happened, the widget will not be able to return the health status correctly.
This is due to the widget type being used in combination with the Prometheus query:
ceph_health_status{instance=~'$instance'}
Hard-coded time zone
A hard-coded time zone in the Grafana dashboard specifications (JSON files) results in the administrator being unable to change the time zone displayed by Grafana for those dashboards, as those dashboards are automatically imported using a Grafana internal mechanism, which prevent administrators to change them (which they shouldn't anyway). Only if the time zone is not set in those dashboards, the value of the global Grafana settings is used. Few dashboards have a hard-coded time zone set.
Convert newlines from CRLF to LF
A single dashboard specification (rbd-details.json) has different line endings (CRLF) than all the other dashboards (LF).
Some widgets are not filterable by the instance label
Basically, this one is about promql queries which do not contain the instance label for some widgets, but there's a discussion about if it should be fixed to be consistent or, for some dashboards/widgets, completely removed. The idea to completely remove the filtering by the instance label stems from the fact that the mgr module is the only way to provide Ceph related metrics, so there'll ever only be one address/node to query, which provides data that is not related to the queried node. So the instance label has no meaningful use.
See discussion in the PR.
Files
Updated by Patrick Seidensal almost 3 years ago
- Status changed from New to In Progress
Updated by Patrick Seidensal almost 3 years ago
- File health_status.jpg health_status.jpg added
- Subject changed from mgr/dashboard: grafana clean-up to mgr/dashboard: Grafana dashboards clean-up
- Description updated (diff)
- Pull request ID set to 41838
Updated by Patrick Seidensal almost 3 years ago
- Status changed from In Progress to Fix Under Review
Updated by Ernesto Puerta almost 3 years ago
- Status changed from Fix Under Review to Pending Backport
Updated by Backport Bot almost 3 years ago
- Copied to Backport #51373: octopus: mgr/dashboard: Grafana dashboards clean-up added
Updated by Backport Bot almost 3 years ago
- Copied to Backport #51374: pacific: mgr/dashboard: Grafana dashboards clean-up added
Updated by Backport Bot over 1 year ago
- Tags changed from grafana to grafana backport_processed
Updated by Konstantin Shalygin 12 months ago
- Status changed from Pending Backport to Resolved