Actions
Bug #48465
openmgr/dashboard: Using FQDNs fails for embedding of Grafana
% Done:
0%
Source:
Tags:
user-experience
Backport:
octopus
Regression:
No
Severity:
5 - suggestion
Reviewed:
Affected Versions:
ceph-qa-suite:
Pull request ID:
Crash signature (v1):
Crash signature (v2):
Description
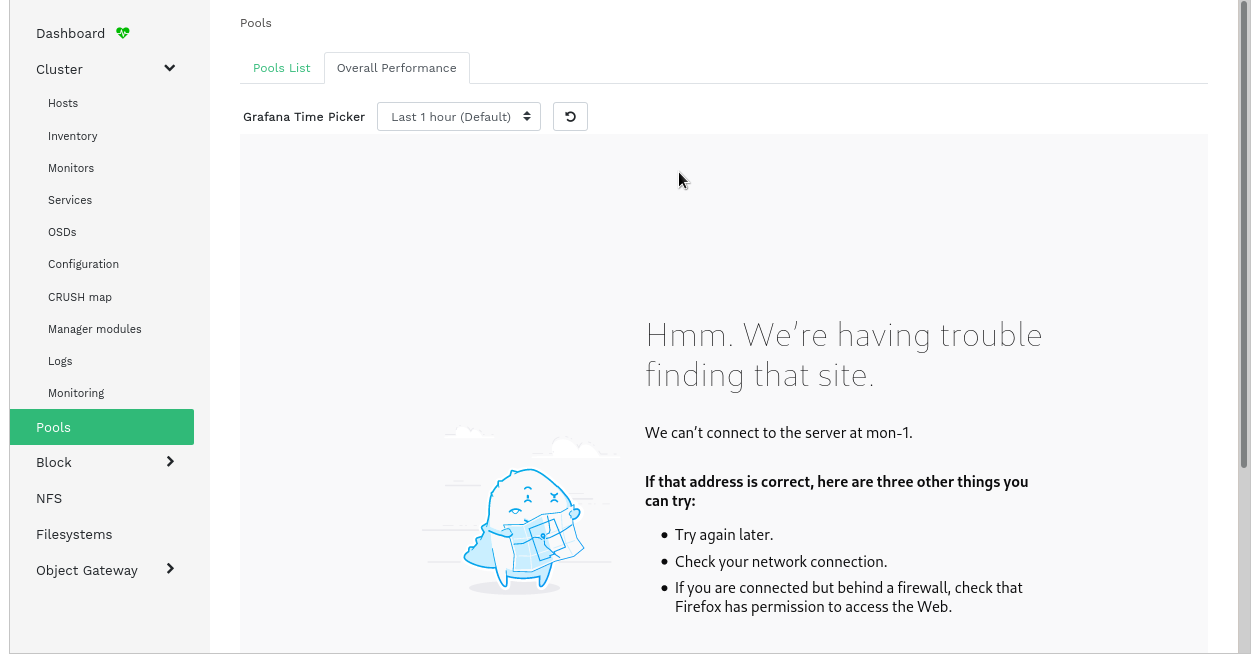
Description of problem
When FQDNs are used for Ceph Dashboard, loading the embedded Grafana will fail, as the URL used for the iframe is not a FQDN. The dashboard will show
Environment
ceph versionstring: Octopus- Browser used (e.g.:
Version 86.0.4240.198 (Official Build) (64-bit)): Firefox
How reproducible
Deploy a cluster in a network which requires FQDNs.
Actual results
Expected results
A more helpful error message, indicating to the user probable causes of or potential solutions to the issue.
Files
Updated by Ernesto Puerta over 3 years ago
Have you tried setting the FQDN URL in the GRAFANA_API_URL?
Updated by Ernesto Puerta over 3 years ago
- Status changed from New to Triaged
- Priority changed from Normal to Low
- Severity changed from 3 - minor to 5 - suggestion
This is partly mitigated by a proper config provided by: https://tracker.ceph.com/issues/47386
Updated by Ernesto Puerta over 3 years ago
- Related to Feature #47386: mgr/dashboard: enable different URL for users of browser to Grafana added
Updated by Ernesto Puerta about 3 years ago
- Project changed from mgr to Dashboard
- Category changed from 148 to Monitoring
Actions