Actions
Bug #47494
closedmgr/dashboard: Dashboard becomes unresponsive when SMART data not available
% Done:
0%
Source:
Tags:
Backport:
octopus
Regression:
No
Severity:
3 - minor
Reviewed:
Affected Versions:
ceph-qa-suite:
Pull request ID:
Crash signature (v1):
Crash signature (v2):
Description
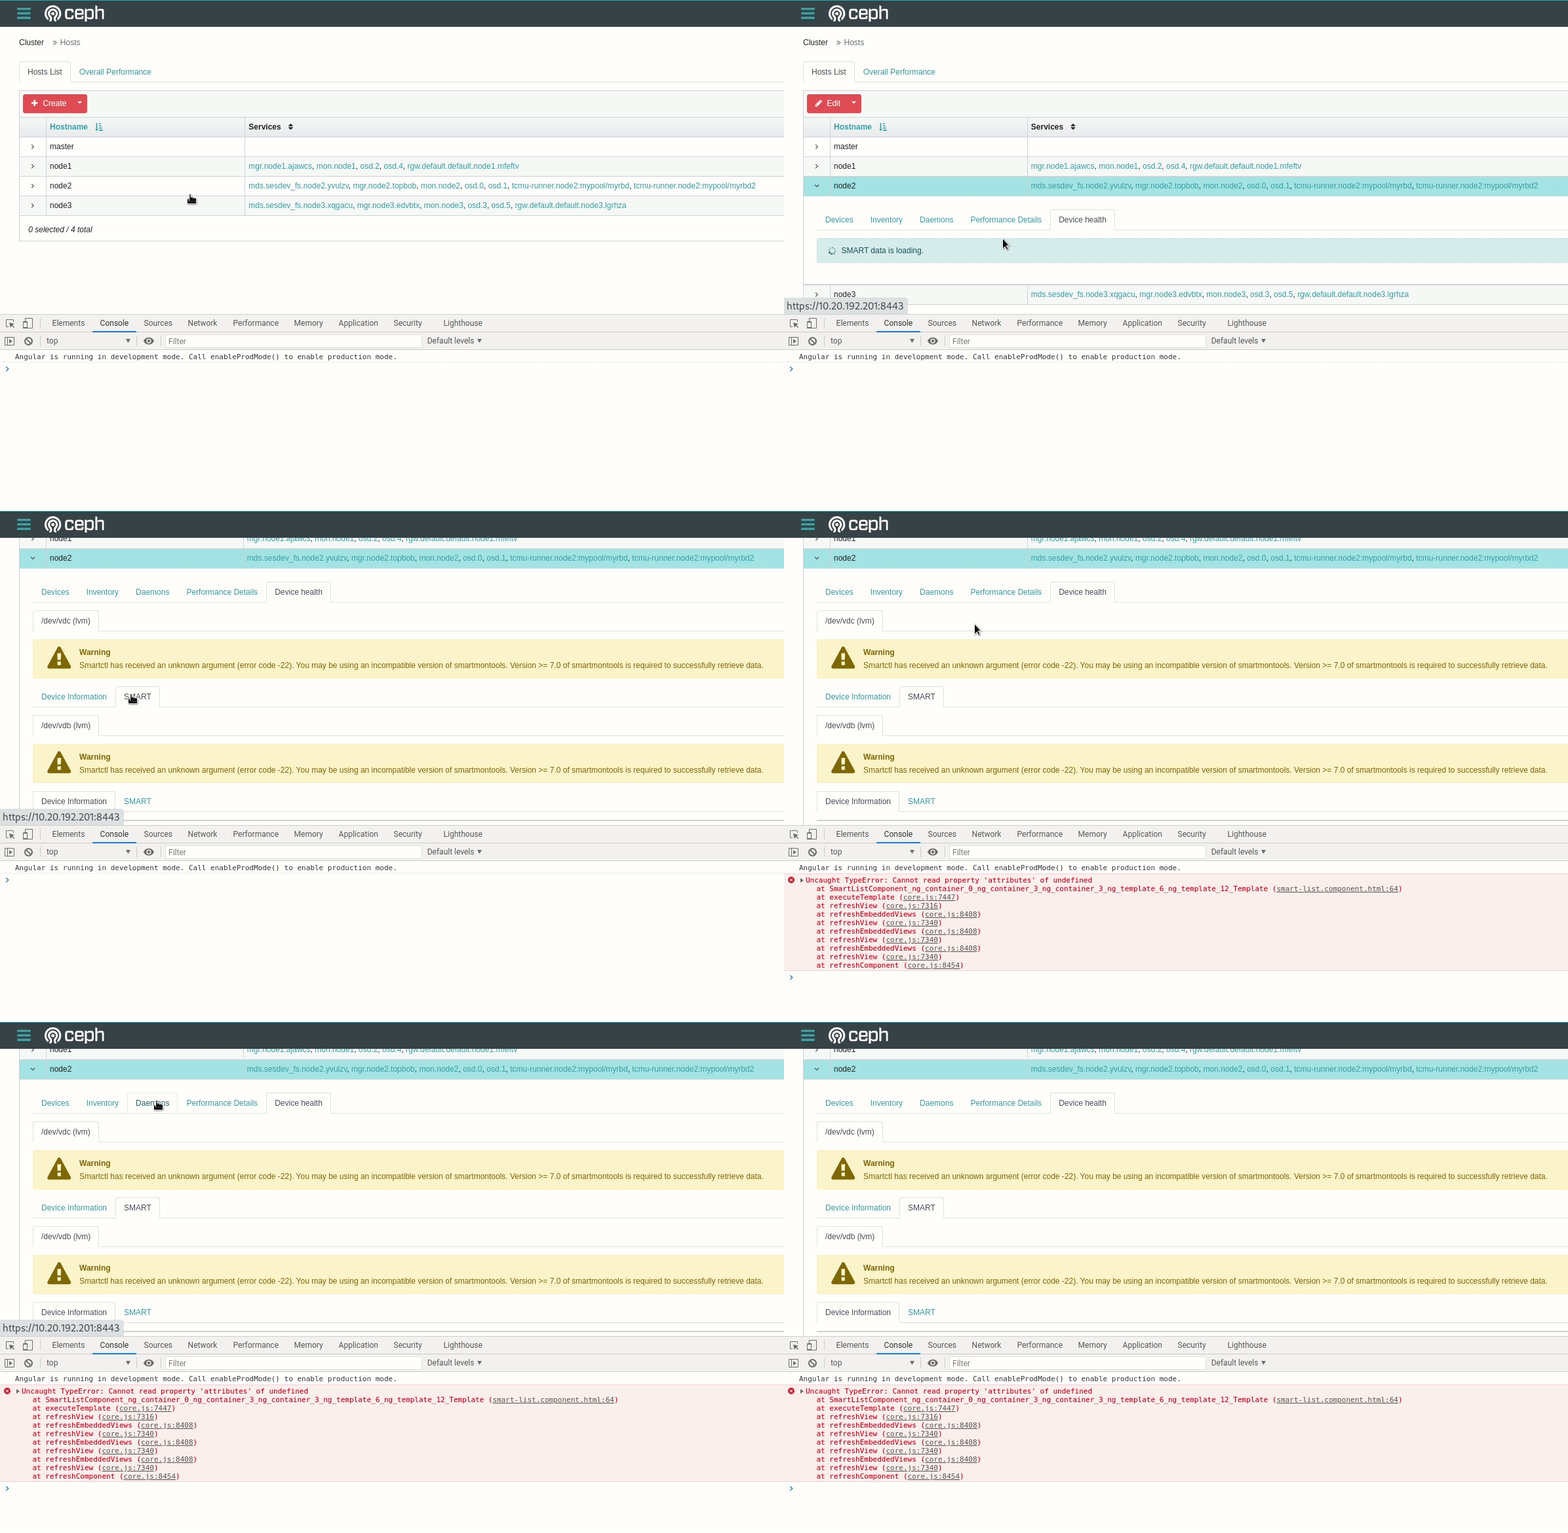
On my environment, 'smartmontools' is not configured, so I see a warning message on "Cluster > Device health" tab, but if I click on the "SMART" tab, the Dashboard UI stops responding and I'm no longer able to click on other tabs:

Files
Updated by Kiefer Chang over 3 years ago
- Status changed from New to In Progress
- Assignee set to Kiefer Chang
- Backport set to octopus
- Affected Versions v15.2.5, v16.0.0 added
Updated by Lenz Grimmer over 3 years ago
- Related to Bug #47188: mgr/dashboard: ceph dashboard does not display device health data, with error message "No SMART data available" added
Updated by Lenz Grimmer over 3 years ago
- Translation missing: en.field_tag_list set to smart
Updated by Kiefer Chang over 3 years ago
- Status changed from In Progress to Fix Under Review
- Pull request ID set to 37275
Updated by Lenz Grimmer over 3 years ago
- Status changed from Fix Under Review to Pending Backport
- Target version set to v16.0.0
Updated by Nathan Cutler over 3 years ago
- Copied to Backport #47657: octopus: mgr/dashboard: Dashboard becomes unresponsive when SMART data not available added
Updated by Volker Theile over 3 years ago
- Related to Cleanup #48051: mgr/dashboard: Use pipe instead of calling function within template added
Updated by Lenz Grimmer over 3 years ago
- Status changed from Pending Backport to Resolved
Updated by Ernesto Puerta about 3 years ago
- Project changed from mgr to Dashboard
- Category changed from 132 to General
Actions