Bug #47049
closedmgr/dashboard: replace endpoint of "This week" time range for Grafana in dashboard
0%
Description
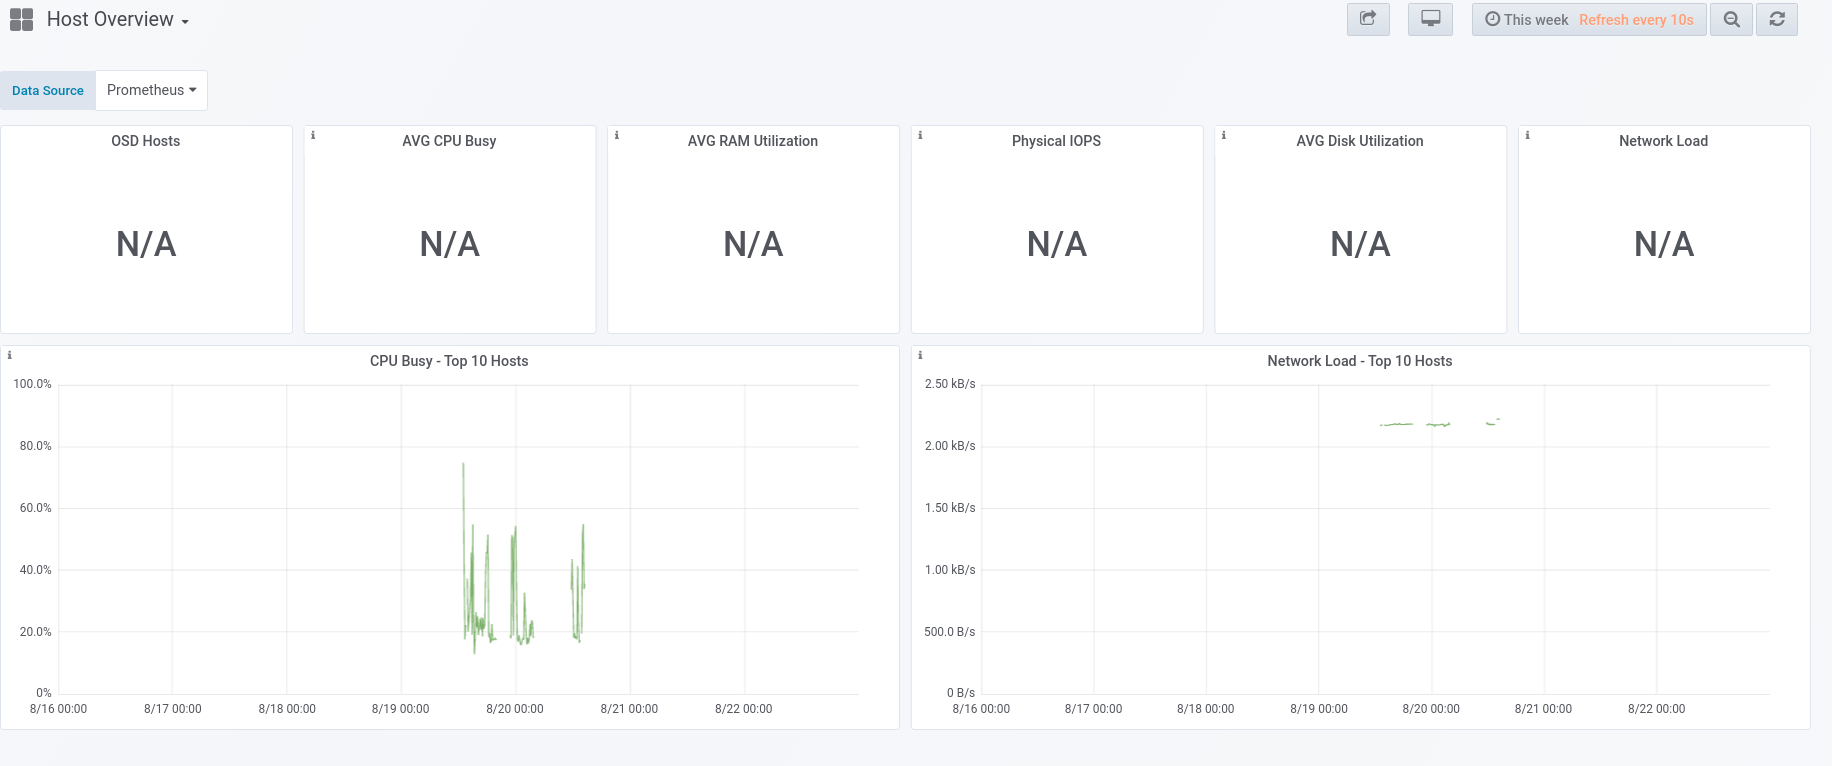
In Cluster-> Hosts-> Overall Performance, it is not showing any metrics (N/A) for "Today/This week/month/year" time stamp. These options tries to get the future data too(as it's trying to show the whole week/month/year/day data, so if we currently aren't in the end of week/month/year/day, it's of no use). We already have "Today/This week/month/year so far" option. As Grafana still has "This week/month/year" and "Today" embedded , the idea is to replace the endpoint of "This w/m/y" to "This w/m/y so far" for now.
Files
Updated by Avan Thakkar over 3 years ago
- Subject changed from mgr/dashboard: fix endpoint of "This week" time stamp for Grafana to mgr/dashboard: replace endpoint of "This week" time stamp for Grafana
- Category set to 148
Updated by Avan Thakkar over 3 years ago
- Subject changed from mgr/dashboard: replace endpoint of "This week" time stamp for Grafana to mgr/dashboard: replace endpoint of "This week" time range for Grafana in dashboard
Updated by Avan Thakkar over 3 years ago
- Status changed from New to Fix Under Review
- Pull request ID set to 36735
Updated by Avan Thakkar over 3 years ago
Avan Thakkar wrote:
In Cluster-> Hosts-> Overall Performance, it is not showing any metrics (N/A) for "Today/This week/month/year" time stamp. These options tries to get the future data too(as it's trying to show the whole week/month/year/day data, so if we currently aren't in the end of week/month/year/day, it's of no use). We already have "Today/This week/month/year so far" option. As Grafana still has "This week/month/year" and "Today" embedded , the proposal is(as discussed in today's upstream standup) to remove "This week/month/year" and "Today" time ranges from the drop-down menu, as it just duplicates the query which is already there in "...so far".
Updated by Lenz Grimmer over 3 years ago
- Status changed from Fix Under Review to Resolved
- Target version set to v16.0.0
Updated by Avan Thakkar over 3 years ago
- Status changed from Resolved to Pending Backport
- Backport set to octopus, nautilus
Updated by Avan Thakkar over 3 years ago
- Copied to Backport #47121: octopus: mgr/dashboard: replace endpoint of "This week" time range for Grafana in dashboard added
Updated by Avan Thakkar over 3 years ago
- Copied to Backport #47122: nautilus: mgr/dashboard: replace endpoint of "This week" time range for Grafana in dashboard added
Updated by Lenz Grimmer over 3 years ago
- Status changed from Pending Backport to Resolved
Updated by Ernesto Puerta about 3 years ago
- Project changed from mgr to Dashboard
- Category changed from 148 to Monitoring