Actions
Bug #45812
openmgr/dashboard/grafana: IOSTAT reporting incorrect high %util values for nvme SSD disks
% Done:
0%
Source:
other
Tags:
Backport:
nautilus, octopus
Regression:
No
Severity:
2 - major
Reviewed:
Affected Versions:
ceph-qa-suite:
Pull request ID:
Crash signature (v1):
Crash signature (v2):
Description
Karan Singh is performing some perf/stress testing on NVMe's and reported that:
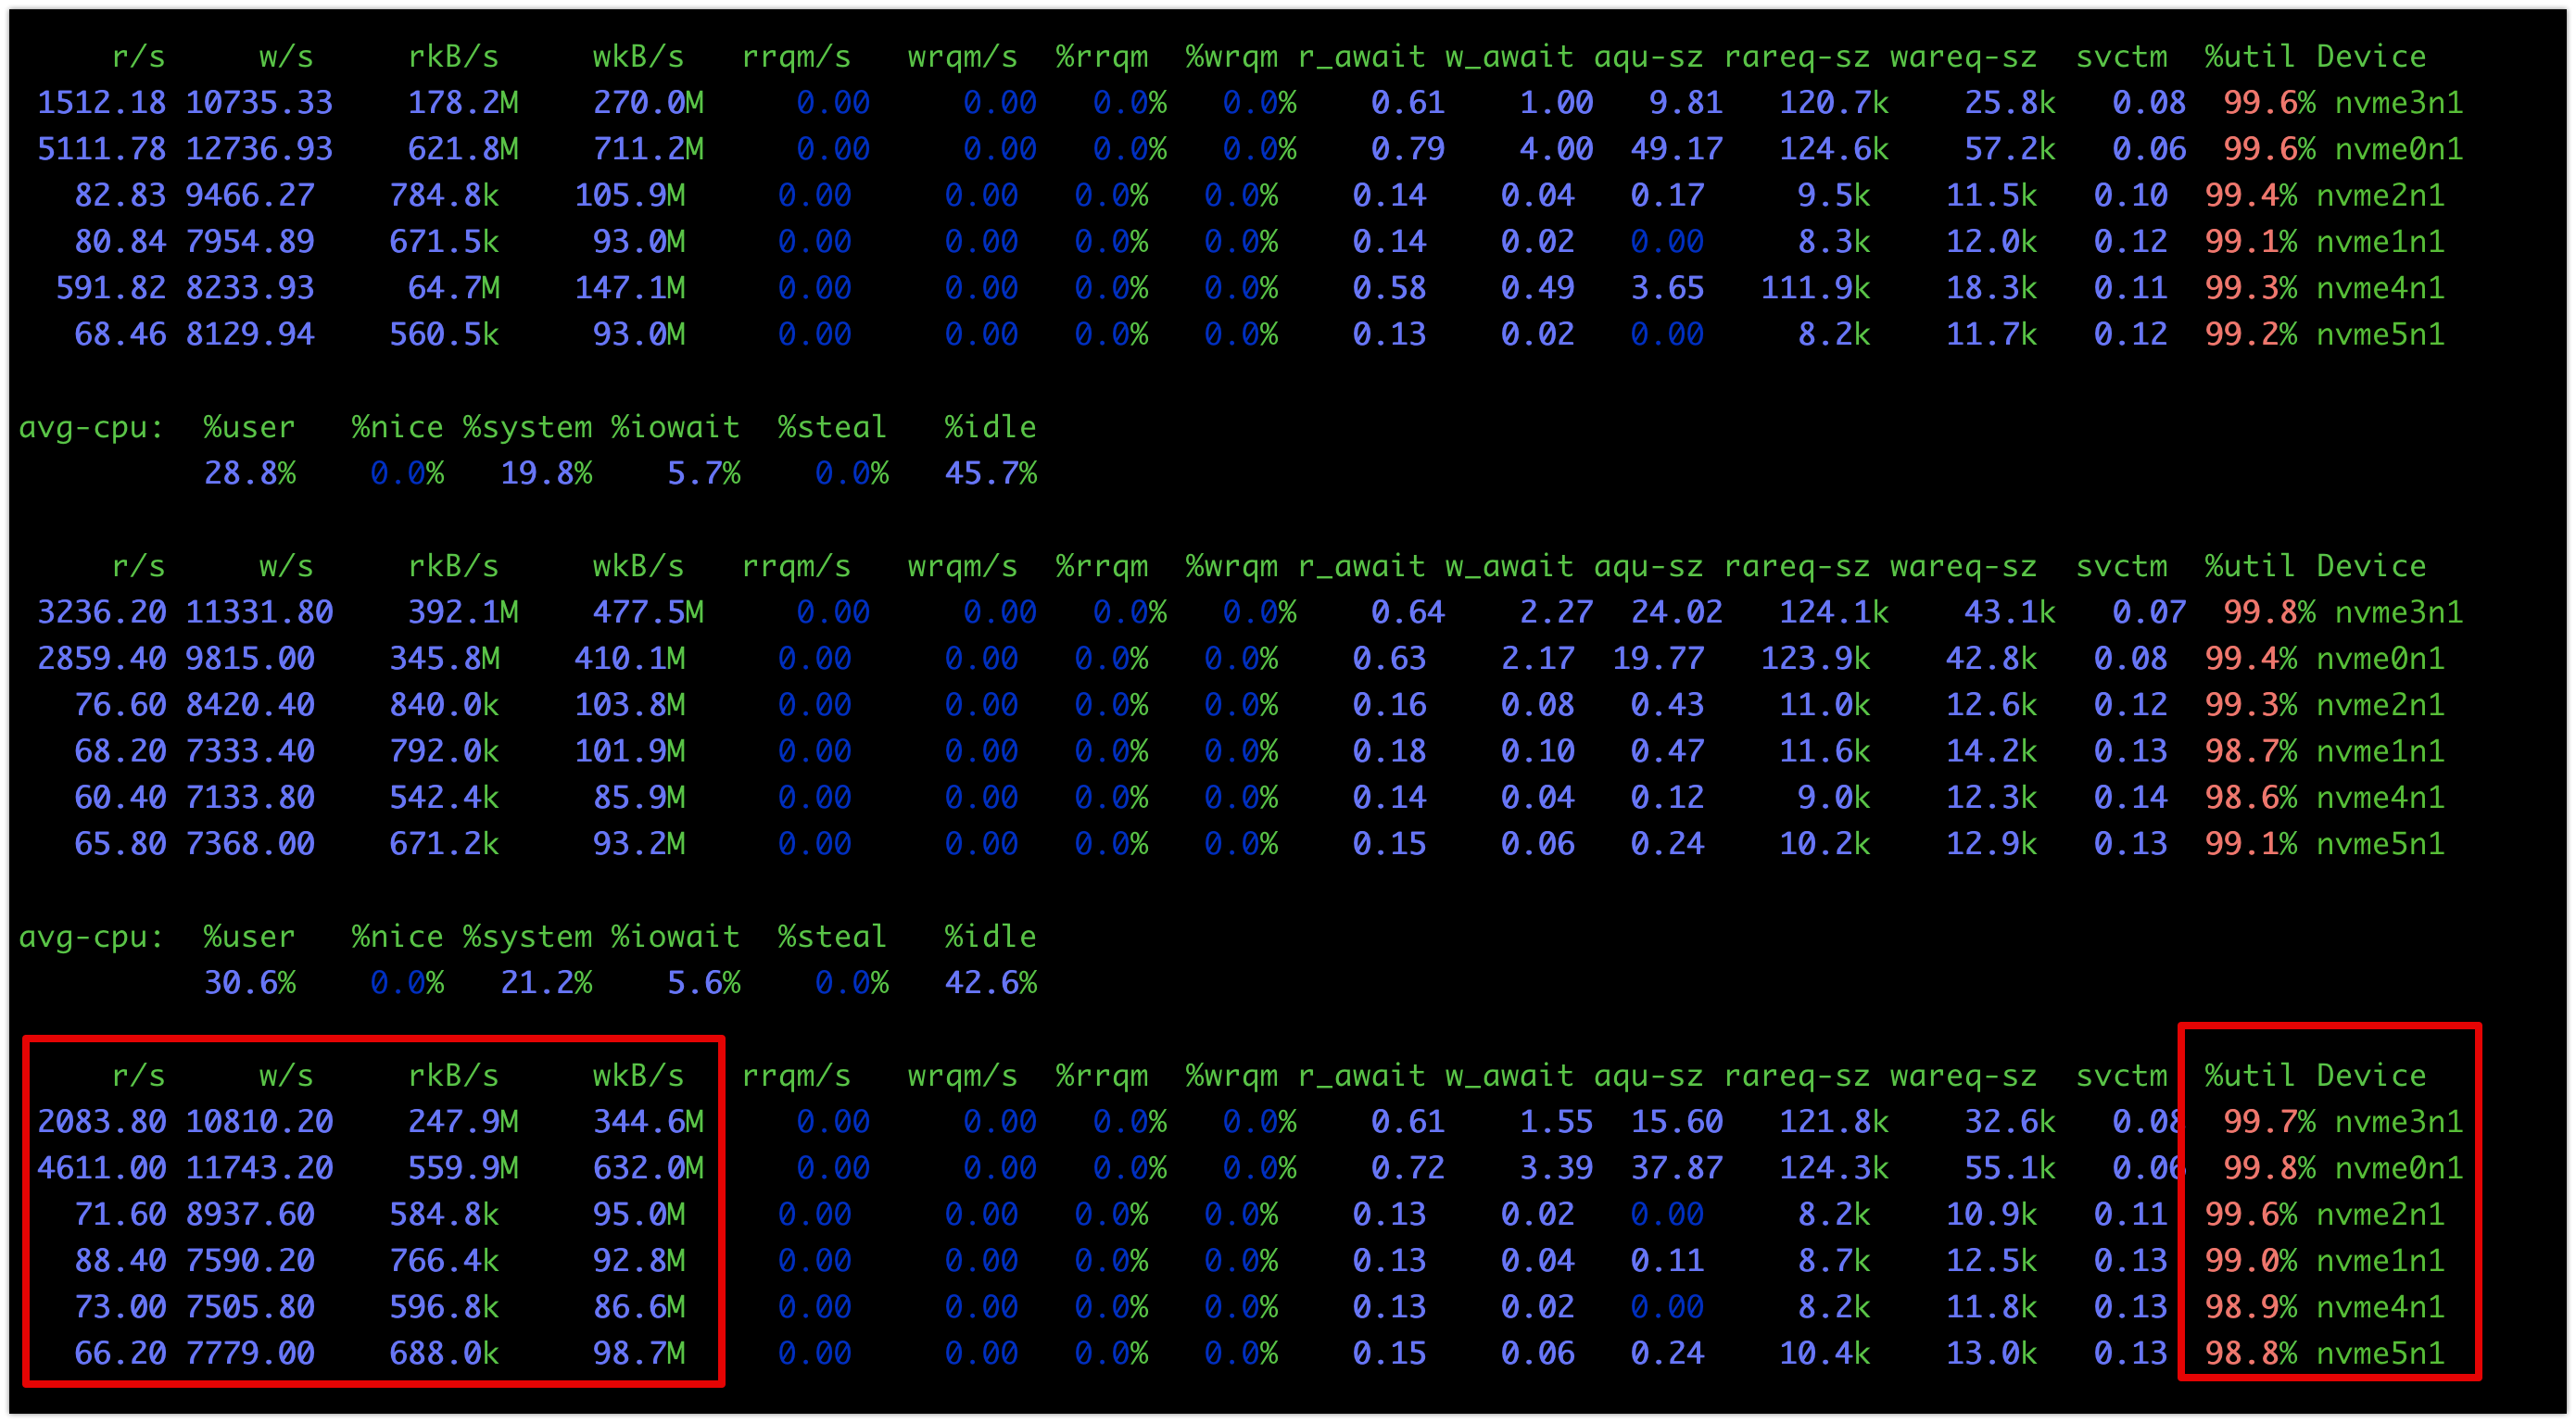
While benchmarking object storage at scale, I found that IOSTAT ( + Prometheus node exporter ) is reporting incorrect high %utilization value for NVMe devices (used for bluestore). In a nutshell, I am hitting this https://access.redhat.com/solutions/3901291 but on RHEL 8.2 4.18.0-147.el8.x86_64 (...) Here are IOSTAT from one of the node + Grafana metrics ( promo node_exporter ) screens

1) Grafana screenshot (image 1)

2) Iostat from one of the node

https://github.com/sysstat/sysstat/issues/187

- These NVMe devices are Intel P4610  and are capable of doing a lot more IO/Throughput . Per this screenshot 500MBps / 11K IOPS (Image 2)

Related BZ (but closed )

https://bugzilla.redhat.com/show_bug.cgi?id=1762869&GoAheadAndLogIn=1
https://bugzilla.redhat.com/show_bug.cgi?id=1226031
Image 1:
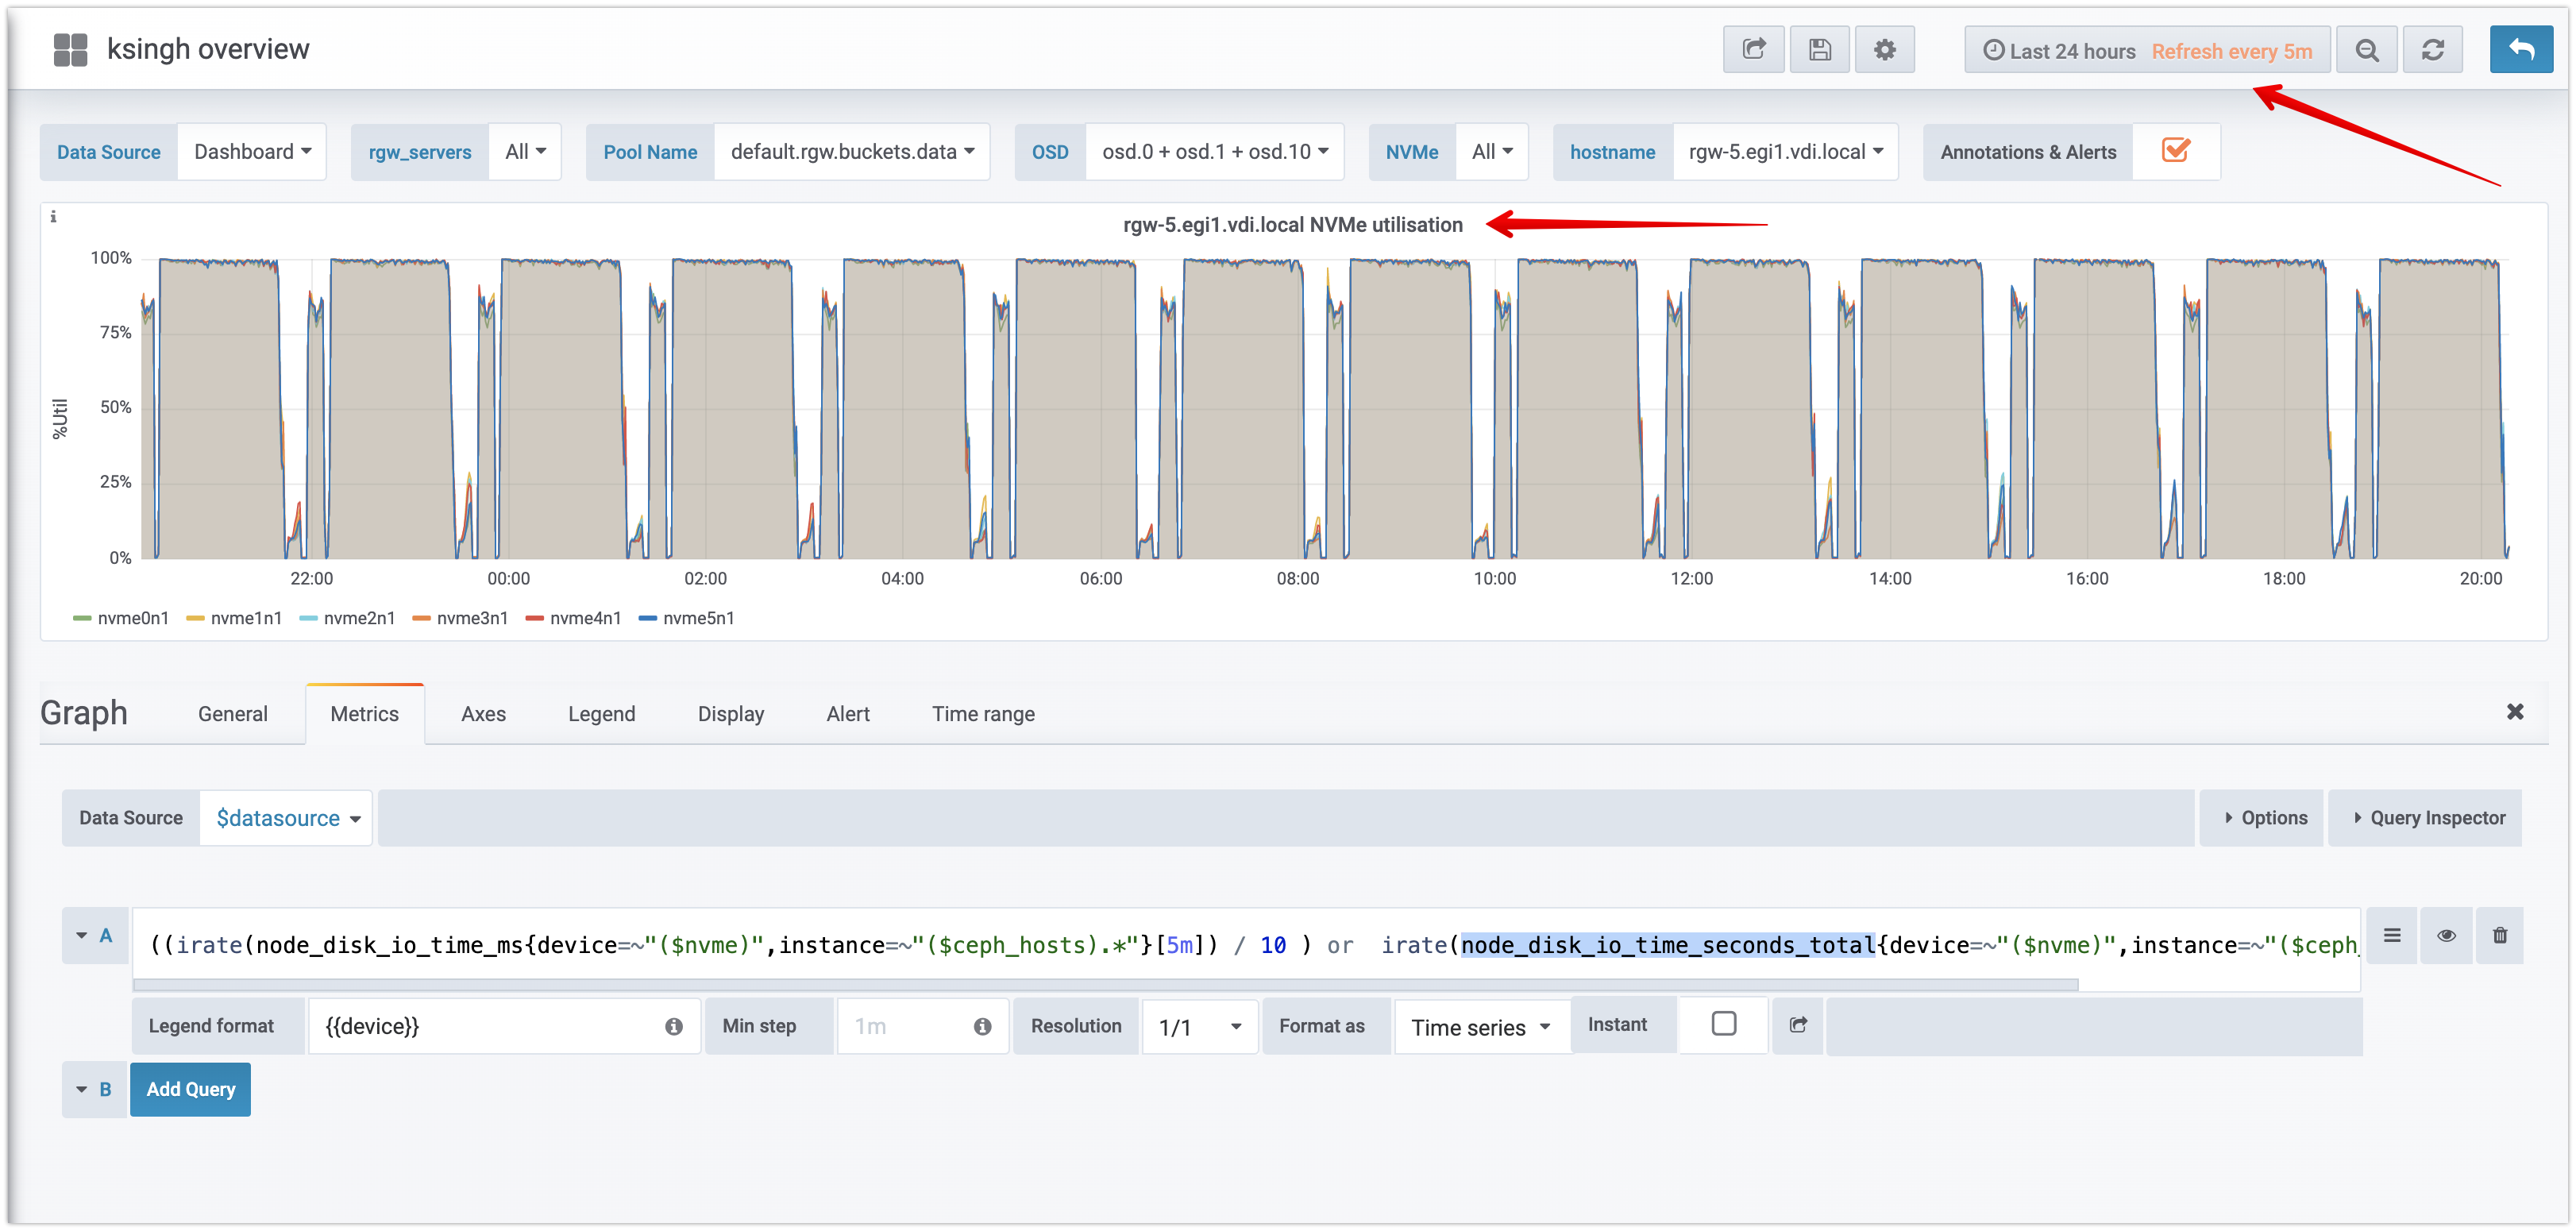
Image 2:
Paul Cuzner clarified:
util as an indicator of saturation has always been a problem when the OS has no visibility of the real device queues (SAN, RAID, NVMe, SSD)

TBH, I thought blk-mq would have gone some way to resolve this - but apparently not.

svctm and %util are becoming pretty useless. In fact svctm is gone in fedora, and marked as 'don't trust it' in rhel8.
@ernesto - we should probably take a view on this with the dashboards embedded in the UI at some point too.

The output doesn't look useful at all. Perhaps an alternate approach to derive saturation is to use X_await and aqu-sz? What you care about is the drop off right, so monitoring *await and quiz could give you that inidcator.

However, I just checked node-exporter and these values are not there, and will need to be computed :(
- check out https://www.robustperception.io/mapping-iostat-to-the-node-exporters-node_disk_-metrics
From dashboard, we currently rely on
node_disk_io_time_* in 3 different dashboards:
host-overviewhost-detailosd-device-details
Files
Updated by Ernesto Puerta about 3 years ago
- Project changed from mgr to Dashboard
- Category changed from 148 to Monitoring
Actions