Bug #40097
closedmgr/dashboard: Dentries value of MDS daemon in Filesystems page is inconsistent with "ceph fs stauts" output
0%
Description
In Filesystems page, currently we use mds.inodes counter for Dentries, which is not aligned to output of ceph fs status command (which use mds_mem.dn).
e.g.
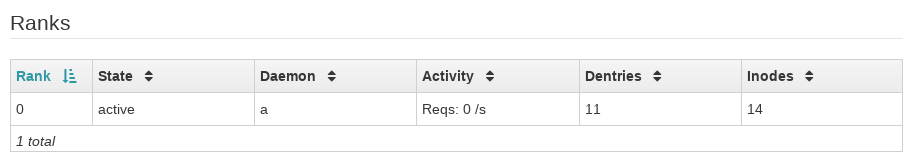
versus
bin/ceph fs status
*** DEVELOPER MODE: setting PATH, PYTHONPATH and LD_LIBRARY_PATH ***
2019-05-31T09:38:50.907+0000 7fea16bf6700 -1 WARNING: all dangerous and experimental features are enabled.
2019-05-31T09:38:50.919+0000 7fea16bf6700 -1 WARNING: all dangerous and experimental features are enabled.
a - 1 clients
=
+------+--------+-----+---------------+-------+-------+
| Rank | State  | MDS |    Activity   |  dns  |  inos |
+------+--------+-----+---------------+-------+-------+
|  0   | active |  a  | Reqs:    0 /s |   12  |   14  |
+------+--------+-----+---------------+-------+-------+
+---------------+----------+-------+-------+
|      Pool     |   type   |  used | avail |
+---------------+----------+-------+-------+
| cephfs.a.meta | metadata |  248M | 9015M |
| cephfs.a.data |   data   |    0  | 9015M |
+---------------+----------+-------+-------+
+-------------+
| Standby MDS |
+-------------+
|      b      |
|      c      |
+-------------+
MDS version: ceph version Development (no_version) octopus (dev)
For dns (Dentries), CLI command switched from using mds.inodes to mds_mem.dn in this change , which suggests that mds_mem.dn is more clear and accurate than mds.inodes.
Also in MDS's counter chart on detail tab, currently counter mds.inodes are displayed. Which also inconsistent with inodes column in Ranks table (display mds_mem.ino counter).
Files
Updated by Lenz Grimmer almost 5 years ago
- Subject changed from Dentries value of MDS daemon in Filesystems page is inconsistent with "ceph fs stauts" output to mgr/dashboard: Dentries value of MDS daemon in Filesystems page is inconsistent with "ceph fs stauts" output
- Backport set to nautilus
- Affected Versions v14.2.0, v14.2.1, v14.2.2 added
Updated by Lenz Grimmer almost 5 years ago
Good spotting! I wonder if these metrics are used in any of the monitoring plugins, e.g. Prometheus?
Updated by Kiefer Chang almost 5 years ago
Lenz Grimmer wrote:
Good spotting! I wonder if these metrics are used in any of the monitoring plugins, e.g. Prometheus?
Yes. They are exported by Prometheus module (test both in Octopus and Nautilus).
So it's possible to create a Grafana dashboard panel with fs metrics.
Updated by Kiefer Chang almost 5 years ago
- Status changed from New to Fix Under Review
- Assignee set to Kiefer Chang
- Pull request ID set to 28505
Updated by Lenz Grimmer almost 5 years ago
- Status changed from Fix Under Review to Pending Backport
Updated by Kiefer Chang almost 5 years ago
- Copied to Backport #40685: nautilus: mgr/dashboard: Dentries value of MDS daemon in Filesystems page is inconsistent with "ceph fs stauts" output added
Updated by Ricardo Marques over 4 years ago
- Status changed from Pending Backport to Resolved
Updated by Ernesto Puerta about 3 years ago
- Project changed from mgr to Dashboard
- Category changed from 142 to Component - CephFS